Download
1 / 42
420 likes | 602 Views
METR112 Global Climate Change – Lecture 3: Earth Hydrological Cycle. Prof. Menglin Jin, San Jose State University. Earth Hydrological Cycle. Relations between heat and water cycles. Temperature Increase and Pan Evaporation decrease Video. http://www.met.sjsu.edu/metr112-videos/

E N D
METR112 Global Climate Change – Lecture 3: Earth Hydrological Cycle Prof. Menglin Jin, San Jose State University Earth Hydrological Cycle
Relations between heat and water cycles • Temperature Increase and Pan Evaporation decrease Video http://www.met.sjsu.edu/metr112-videos/ MET%20112%20Video%20Library-MP4/hydrological%20cycle/ DTS-3.mp4
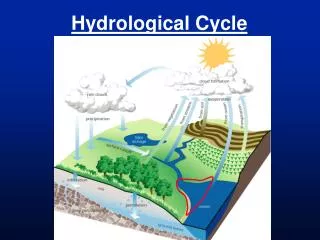
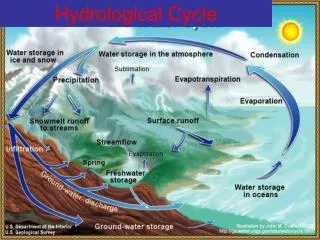
What is hydrological cycle Major components of hydrological cycle • Precipitation • Evaporation & evapotranspiration • Atmospheric transport • Runoff and ground water flow • Water reservoir (ocean, lake, glacier, soil water, etc.) The hydrological cycle. Estimates of the main water reservoirs, given in plain font in 103 km3, and the flow of moisture through the system, given in slant font in103 km3/yr, equivalent to Exagrams (1018 g) per year. (Trenberth et al. 2006a).
Rain gauge Precipitation: Standard rain gauge used in observing precipitation
Precipitation: Radar & satellite Radar detecting the cloud by collecting reflected microwaves Satellite observe earth in microwave or infrared channels from space and estimate precipitation using retrieval techniques
Precipitation: Observations show great spatial variation Bosilovich et al. DOI: 10.1175/2008JAMC1921.1
Precipitation: Observations show decadal variation of precipitation change
Precipitation: Observations show decadal variation of precipitation change alternative Different data sets all show similar decadal variations
Precipitation: Changes are not spatially uniform • General increase of precipitation in most areas in mid- and high latitude, • Decreased precipitation in the Western, Southern Africa and Sahel • With mixed signs in Eurasia • Precipitation increases in Northwest India IPCC AR4
Precipitation variation is complex over the land Increases Decreases Source: IPCC AR4 - Chapter 3, Adopted from: Richard CJ Somerville, APRU World Institute Workshop, 2007
Video • http://www.met.sjsu.edu/metr112-videos/MET%20112%20Video%20Library-MP4/hydrological%20cycle/ DTS-3.mp4
Precipitation: Changes in seasonal variations vary spatially (Chen et al. 2002)
Precipitation: Intensified extreme precipitation in mid-latitudes • More wet days (upper 5%) and heavy precipitation (upper 5% percentile) in US and most Europe • Increased possibility of intense precipitation in most extratropical regions • Decrease of heavy precipitation in central Africa, south east Asia, west Europe and west Australia IPCC AR4
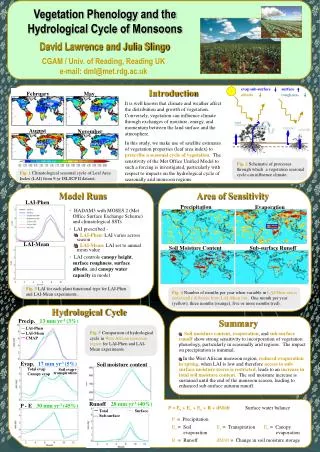
Significant decrease in East Asian Monsoon index since 1976/77 climate shift Rainfall decrease Figure 3.35. Annual values of the East Asia summer monsoon index derived from MSLP gradients between land and ocean in the East Asia region. The definition of the index is based on Guo et al. (2003) but was recalculated based on the HadSLP2 (Allan and Ansell, 2006) data set. The smooth black curve shows decadal variations. East Asian summer monsoon index: Sum of mean sea level pressure differences between 110o and 160oE for 20o to 50oN with 5o difference.
Current global climate a boon for Australian Monsoon? • Statistically significant rainfall show up in predominantly northern parts of Australia • Primarily due to additional southern Australian land heat up while no/cold • Anomalous changes in oceans Figure 3.36. Time series of northern Australian (north of 26°S) wet season (October–April) rainfall (mm) from 1900/1901 to 2004/2005. The individual bar corresponds to the January of the summer season (e.g.,1990 is the summer of 1989/1990). The smooth black curve shows decadal variations. Data from the Australian Bureau of Meteorology.
African Monsoon shows clear signal due to changes in ENSO Figure 3.37. Time series of Sahel (10ºN –20ºN, 18ºW–20ºE) regional rainfall (April–October) from 1920 to 2003 derived from gridding normalised station anomalies and then averaging using area weighting (adapted from Dai et al., 2004a). The smooth black curve shows decadal variations. • Both tropical Pacific and Atlantic SSTs have effects on African Monsoon • Many studies show deforestation would amplify draught signals
Evaporation (evapotranspiration) observations are limited Bowen ratio system observes evapotranspiration using energy balance Pan evaporation observes the potential evaporation
Would distribution of annual averaged Latent heat flux from 1979 to 2001 from reanalysis (Trenberth and Stepaniak 2003)
Trend of pan evaporation in US from 1950 to 2001 annual Blue (red) is decrease (increase), circle is sig at 90% Warm season Hobbins and Ramirez 2004
Zonally-averaged annual evaporation shows an M-shaped distribution 15-year ECMWF reanalysis Garnier et al. 2000 ERA15 (solid curve), COADS (dashed), CE91-95 (dotted curve)
One way of measuring soil moisture: gravimetric method Two types of augers used for gravimetric soil moisture observations, sitting on a neutron probe. The one on the left is pounded into the ground and used when the ground is frozen. The one on the right is twisted into the ground Robot et al. 1999
Major soil moisture climate regimes soils.usda.gov/use/worldsoils/mapindex/smr.html
Seasonal cycles of soil moisture for various areas Robot et al. 1999
Relations between heat and water cycles Jim Hansen: • Temperature change and hydrology cycle Video http://www.met.sjsu.edu/metr112-videos/ MET%20112%20Video%20Library-MP4/hydrological%20cycle/ DTS-9.mp4
Snow: Decreased spring snow covered area in Northern America • Statistically significant decline in annual SCA for 2.7x10^4 km^2 • SCA maximum shift from February to January and earlier snow melt • Melting season shift two weeks earlier from 1972 to 2002
Snow cover anomalies in from 1966 to 2006 for northern America http://www.arctic.noaa.gov/detect/ice-snow.shtml
Snow cover anomalies in from 1966 to 2006 for Eurasia http://www.arctic.noaa.gov/detect/ice-snow.shtml
Sea ice: Arctic sea ice extent decreases in the last 20 years annual: -2.7%/dec The annual sea ice extent decrease steadily from 1980
Summer sea ice decrease in tremendous in the last 20 years summer: -7.4%/dec Most remarkable change is the summer sea ice diminish, in which the interannual to decadal variability is associated with the variability of atmospheric circulation
Glacier: Glacier and ice cap mass loss in response to 1970 warming (Science basis, Chap.4, Fig.4.15) • Strong negative specific mess balances in Patagonia, Alaska after mid 90s, cumulative balance equivalent to 10m of water (11m of ice) • Total mass loss are contributed mainly from Alaska (0.24 mm/yr of SLE), Arctic (0.19 mm/yr of SLE) and Asia high mountains (0.1 mm/yr of SLE)
Muir glacier , Alaska 1941 2004
Greenland melt extent seeing from satellite 2005 summer ice extent set a record during 27-year period. 2005 also shows a especially long melting season (until late Sep) compared to previous years according to Steffen et al. 2004, Hanna et al. 2005
Greenland melt area during summer time increases from 1979 to 2005
Shrinking of Greenland ice-sheet in a warmer climate Evolution of Greenland surface elevation and ice sheet volume versus time in the experiment of Ridley et al. (2005) with the UKMO-HadCM3 AOGCM coupled to the Greenland Ice Sheet model of Huybrechts and De Wolde (1999) under a climate of constant quadrupled pre-industrial atmospheric CO2.
Class Participation 2/10/2010 • Work with your groupmates to Find out the changes in hydrology cycle (in terms of rainfall, soil moisture, EP, and snow coverage etc) in your grandmother’s hometown/home country