Download
1 / 27
270 likes | 409 Views
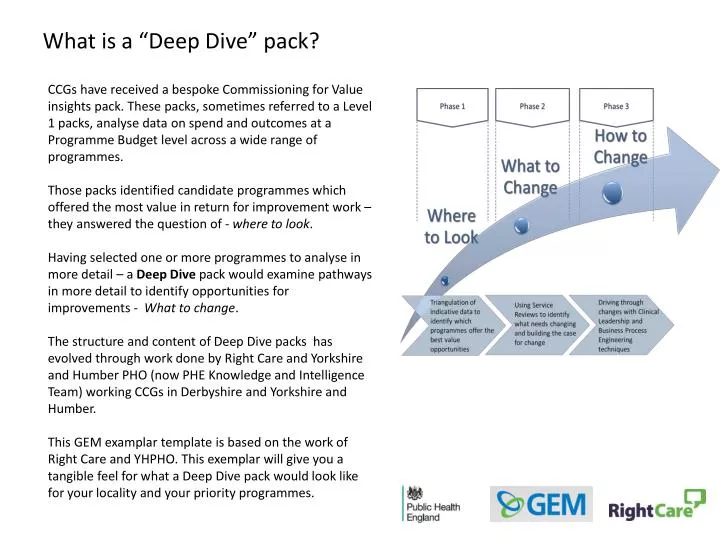
What is a “Deep Dive” pack?. CCGs have received a bespoke Commissioning for Value insights pack. These packs, sometimes referred to a Level 1 packs, analyse data on spend and outcomes at a Programme Budget level across a wide range of programmes.

E N D
What is a “Deep Dive” pack? CCGs have received a bespoke Commissioning for Value insights pack. These packs, sometimes referred to a Level 1 packs, analyse data on spend and outcomes at a Programme Budget level across a wide range of programmes. Those packs identified candidate programmes which offered the most value in return for improvement work – they answered the question of - where to look. Having selected one or more programmes to analyse in more detail – a Deep Dive pack would examine pathways in more detail to identify opportunities for improvements - What to change. The structure and content of Deep Dive packs has evolved through work done by Right Care and Yorkshire and Humber PHO (now PHE Knowledge and Intelligence Team) working CCGs in Derbyshire and Yorkshire and Humber. This GEM examplar template is based on the work of Right Care and YHPHO. This exemplar will give you a tangible feel for what a Deep Dive pack would look like for your locality and your priority programmes.
Commissioning for Value Focus Pack CCG: XXXX Focus Area : XXXXXXX
Contents • Background and context • Aims of the packs • Packs as part of transformation process • Methodology • Analysis methods • Analysis • Summary messages • Analysis by pathway stage • Practice level variation • Secondary care quality • Bringing it all together • Next Steps • Annexes • Annex 1: Detailed indicator spine charts • Annex 2: CCG Benchmarks • Annex 3: Data sources • Annex 4: What works
Aims of the Packs The Commissioning for Value phase one packs, produced by NHSE, PHE and NHS Right Care, included an offer to work with CCGs to develop this Focus Pack, or ‘deep dive’. The deep dive looks at an agreed programme area to understand variation across the pathway, including GP practice benchmarking. Working with local BI teams, the deep dive will look to identify opportunities for improvement together with the best evidence on the design of an optimal clinical pathway. Further support is available to use and explore the intelligence in this pack
Analysed wide range of indicators from across the pathway focussing on spend and quality • Analysed wide range of national benchmarked data to identify indicators where CCG is below the average for its cluster group • Identified indicators where CCG is in worst quintile within its cluster • Analysed practice based variation to identify practices which consistently compare poorly against their national clusters Methodology used to produce this pack • Identified key opportunities for value improvement and quantified potential impact • Listed all the indicators where CGG is below average for cluster (see Annex) • Quantified opportunity for indicators in bottom quintile from moving to average of top 40% for cluster • Quantified additional financial opportunities for other indicators from moving to average of top 40% for cluster • Quantification does not mean that the ‘saving’ or improvement can actually be made, but may however answer the question ‘Is it going to be worth focussing on this area?’ • Reviewed national evidence base to identify potential interventions linked to opportunities • Pulled together examples of ‘what works’ against ‘opportunity’ areas across the pathway • Identified ‘high performing’ CCGs from cluster to support potential service/pathway review
Prevention and Prevalence Prevention 4/5 indicators are below the average of the top 40% benchmark group If the CCG reached the average of the top 40% in its benchmark group, 1,978 fewer people with a long term condition would smoke The CCG is in the highest quintile for binge drinking. This is based on a PCT modelled estimate from the Health Survey for England. If the estimate is correct then 20,161 fewer people would binge drink if the CCG reduced its rate to the benchmark average for the top 40%. The CCG may want to triangulate this with other indicators, for example alcohol related admissions Prevalence 9/10 indicators are above the average of the 40% benchmark group For CHD, stroke and hypertension the observed prevalence can be compared with that expected given the characteristics of XXX CCG’s population. For CHD the expected to observed ratio exceeds that of the 40% benchmark group. For stroke a further 83 cases and for hypertension a further 3,492 would need to be observed to achieve the expected to observed ratio of the 40% benchmark group.
Management in Primary Care 18/22 indicators are below the average of the top 40% benchmark group QOF indicators have been used but excepted patients have not been included in the denominator There are no indicators in the bottom quintile compared to the benchmark group There are three primary care management indicators where over 150 patients would benefit if the CCG moved to the average of the top 40% benchmark group • % CHD patients treated with a beta-blocker (182 more people) • % CHD patients who have had a flu immunisation (202 more people) • % hypertension patients with a record of BP <=150/90 (371 more people) £1.2 million reduced prescribing spend in primary care if CCG reduced to average of the 40% benchmark group
Summary: Management in secondary care and end of life care Management in secondary care 60/66 indicators are below the average in the top 40% benchmark group CVD, and within that classification, CHD and heart failure emergency admissions are all high (bottom quintile) compared to the benchmark group. Although the rate of elective CHD admissions is relatively low, the cost of admission is relatively high (£270k more than average of top 40% benchmark group). LOS for CHD elective (280 bed days higher), stroke (over 3000 bed days higher) and angiography (over 1000 bed days higher) are all relatively high when compared to the average of the top 40% benchmark. End of life care An additional 78 people would die at home if the CCG rate matched that of the top 40% benchmark group
Where does the CCG compare poorly against its benchmark group?Analysis by pathway stage (1)
Where does the CCG compare poorly against its benchmark group?Analysis by pathway stage (2)
Where to focus: Understanding practice variation Practices have been compared against other practices within their practice cluster for all the indicators where data is available at practice level This information is presented here to form the basis of a discussion between the PHO, Business Intelligence in the CSU and the CCG about how further analysis could support practices in reducing unexplained practice variation The number of indicators where the practice is in the bottom quintile for the practice cluster has been compared on the next slide and the opportunities for the practices with the highest number of indicators in the bottom quintile has been quantified on the subsequent slide Practices will have less influence on management in secondary care than they do on management in primary care and this should be taken into account in the way CCGs interpret the information on practice variation
Where to focus: Understanding practice variation Number of CVD indicators in the bottom quintile of the practice cluster Note, some of the data are based on small numbers. Statistical significance has not been tested and should not be inferred. The data are presented to identify potential areas of improvements rather than providing a definitive comparison of performance.
Where to focus: Top 3 GP practices with CVD indicators in the bottom quintile of the practice clusterand opportunities* in brackets • * If they were to equal the practice cluster average • Note, X practice does not have a practice cluster assigned to it and has been compared to the national average. Some of the secondary care opportunities calculated for this practice are greater than the number of original admissions due to small numbers and comparison to the national average.
Bringing it all together – Where to focus, what could work, who should we speak to
Other local intelligence to add in……… CCGs should consider what local intelligence is available to further triangulate with the intelligence in this pack. This may include: Practice variation analyses Up to date intelligence from secondary care Analysis from Acute Trust quality dashboard or other provider data Contract monitoring data Local prescribing data There are also many resources available on www.rightcare.nhs.uk to take forwards the improvement agenda.