Download
1 / 40
410 likes | 682 Views
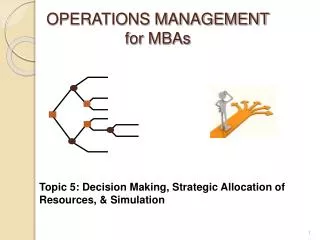
OPERATIONS MANAGEMENT for MBAs Fourth Edition. Meredith and Shafer. John Wiley and Sons, Inc. Topic 2: Capacity Planning & Forecasting. Outline. Capacity Planning Overview Utilization & Efficiency Effectively Utilizing Capacity / Resource Planning & Scheduling Production Planning

E N D
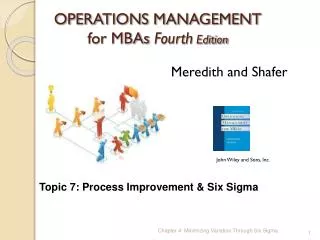
OPERATIONS MANAGEMENTfor MBAs Fourth Edition Meredith and Shafer John Wiley and Sons, Inc. Topic 2: Capacity Planning & Forecasting Chapters 8 & 8S : Capacity, Forecasting
Outline • Capacity Planning Overview • Utilization & Efficiency • Effectively Utilizing Capacity / Resource Planning & Scheduling • Production Planning • Aggregate Plan • Master Production Schedule • The Learning Curve • Forecasting • Homework
Capacity Planning Decisions Demand Estimates Forecast Market Corporate Strategy Skills Suppliers & Customers
Capacity Maximum rate outputs can be produced or services delivered. Maximum amount of availability for a product or service.
Forecast of capacity required Capacity increment Capacity Time between increments Time Capacity Timing Planned unused capacity (a) Preceding Demand or Expansionist strategy
Forecast of capacity required Capacity increment Capacity Time between increments Time Capacity Timing Planned use of short-term options (b) Following Demand or Wait-and-see strategy
Location Planning Strategies Possible Factors affecting location decisions
1600 A (20, 1390) 1400 (20, 1200) D 1200 B (20, 1060) C 1000 Annual cost (thousands of dollars) (20, 980) 800 Break-even point 600 Break-even point 400 200 A best B best C best 0 2 4 6 8 10 12 14 16 18 20 22 6.25 14.3 Q (thousands of units) Breakeven Location Model
Utilization Time Busy / Time Available Actual output / capacity Average output rate / capacity Occupied (in use) / amount available
Efficiency total task time / (N X cycle time) Capacity or Output Rates: 15 units/hr 20 units/hr 6 units/hr 30 units/hr 100% 75% 100% 20% Littlefield Utilization: 40% 30% 100% 20% Utilization: Efficiency = 19 / (4 X 10) = .475 = average utilization based on cycles cycle time time at which every workstation can pass its completed part to the next station
Efficiency total task time / (N X cycle time) 2nd Machine C 5 Capacity or Output Rates: 15 units/hr 20 units/hr 12 units/hr 30 units/hr 100% 80% 60% 100% 40% Utilization: Efficiency = 19 / (5 X 5) = .76 = average utilization based on cycles cycle time time at which every workstation can pass its completed part to the next station
Bottlenecks 5 per hour 15 per hour 7 per hour
Bottleneck Operation 120/hr. Operation 210/hr. Operation 315/hr. Maximum output ratelimited by bottleneck Bottlenecks
The following diagram describes a process that consists of eight separate operations, with sequential relationships and capacities (units per hour) as shown.a. What is the current capacity of the entire process?b. If you could increase the capacity of only two operations through process improvement efforts, which two operations would you select, how much additional capacity would you strive for in each of those operations, and what would the resulting capacity of the entire process be? 15/hr. 10/hr. 5/hr. 30/hr. 8/hr. 12/hr. 34/hr. 20/hr. 8 5 1 3 6 4 2 7
Cushion High Cushion Low Cushion
Resource Planning Long-Range Capacity Planning Aggregate Planning Chase Plan Level Plan Master Production Schedule Master Production Schedule Inventory Information Production Planning
Resource Planning MPS gets further broken down in the MRP.
Resource Planning • At the heart of any organization • Starts with sales and operations plans (or aggregate plan) and plans the input requirements • A process relative to the firm’s competitive priorities and an important part of managing supply chains
Resource Planning Aggregate Plan
Materials Requirements Planning An information system that translates master schedule requirements for end items into time-phased requirements for subassemblies, components, and raw materials. Aids in managing dependent demand inventory. Primary Inputs: Master Production Schedule Bill of Materials Inventory Records
Authorized master production schedule Other sources of demand Engineering and process designs Inventory transactions Inventory records Bills of materials MRP explosion Material requirements plan MRP Inputs
Master Production Schedule MPS for a single end item Aggregate Plan
Bill of Materials • A record of all components of an item • Shows the parent-component relationship • The usage quantities are derived from engineering and process design • Five common terms • End items • Intermediate items • Subassemblies • Purchased items • Part commonality (sometimes called standardization of parts or modularity)
Back slats Seat cushion Leg supports Seat-frame boards Back legs Front legs A Ladder-back chair Bill of Materials BOM for a Ladder-Back Chair
B (1) Ladder-back subassembly C (1) Seat subassembly D (2) Front legs E (4) Leg supports F (2) Back legs G (4) Back slats H (1) Seat frame I (1) Seat cushion J (4) Seat-frame boards Bill of Materials A Ladder-back chair
Bill of Materials If 50 units of of end item A are to be assembled, how many additional units of D are needed? Of E? A B(3) C(1) D(1) E(2) F(1) D(1) G(1)
Inventory Record • Inventory transactions are the basic building blocks of up-to-date records • Transactions include releasing new orders, receiving scheduled receipts, adjusting due dates for scheduled receipts, withdrawing inventory, canceling orders, correcting inventory errors, rejecting shipments, and verifying losses and stock returns • Inventory records divide the future into time periods called time buckets • Keep track of inventory levels and component replenishment needs
Scheduledor plannedreceipts inweek t Projected on-handinventory balanceat end of week t Inventory onhand at end ofweek t–1 Grossrequirementsin week t = + – Inventory Record • The time-phase information contained in the inventory record consists of: • Gross requirements • Scheduled receipts • Projected on-hand inventory • Planned receipts • Planned order releases
Planning Factors • Lot-sizing rules • Fixed order quantity (FOQ) rule maintains the same order quantity each time an order is issued • Lot for lot (L4L), order what is necessary • Periodic order quantity (POQ), order what is necessary to handle P periods
BOM A B(1) C(2) D(1) MRP Example, Given MPS, Inv Records, BOM MPS for End Item A, LT=1, Beg Inv=0 Inventory Records
The Learning Curve • The ability to increase productive capacity through “learning.” • Each time the output doubles, the labor hours decrease by a fixed percentage of their previous value. • Common LC values are 70 to 95 percent.
LC Application • A customer support center has a 90 (or 0.90) percent learning curve rate for handling customer issues. A new rep has just begun work. Her first support call required 2000 seconds. • Estimate the time needed to complete her first 5 calls. • Estimate the time needed to complete her 5th call. • Estimate the time needed to complete calls 21 through 25. 0.9 Using the Tables 2000 X 4.339 = 8,678 2000 X 0.783 = 1,566 Using the Tables 2000 X 17.71 = 35,420 (length of first 25 calls) 2000 X 14.61 = 29,220 (length of first 20 calls) 6,200
LC Application A manager wants to estimate an appropriate LC rate for a new type of work his firm will undertake. He has obtained the following completion times for the initial 8 repetitions of a job of this type. What learning curve rate is appropriate? Estimate the duration to complete job unit 45.
Factors that may affect the LC rate • Complexity of the task • Human component