Navigating Small Area Statistics for Insightful Analysis
Discover the significance of small area statistics, key terminology in Census geography, and how to utilize Statistics Canada tools for spatial data analysis. Learn why small area statistics matter, their relevance in various fields, privacy concerns, cost implications, and the value of geographic displays in conveying complex data effectively. Explore the Census geography hierarchy and essential tools for understanding statistical hierarchies.

Navigating Small Area Statistics for Insightful Analysis
E N D
Presentation Transcript
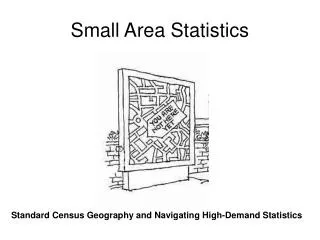
Small Area Statistics (Tiny, tricky geographies, and the people who need them)
Geography and Statistics: the ‘Where” • There’s always a ‘where’ (+ time + variables) • The importance of the where varies depending on what you’re examining • Like statistics, ‘where’ displays often spur new ‘why’ questions
Why learn about small area stats? • Small area statistics: • are essential for certain types of analyses • can be challenging to find, understand and to work with; • can answer local and very specific questions • can be expensive to produce and obtain (i.e. present access challenges)
Small Area Statistics Objectives today - to build understanding of: • The relationship between geography and statistics • The terminology and hierarchical structure of Census geography, to understand commonly accessible smaller units • Other small geographical units important to statistical display which are important/frequently requested • How to use key Statistics Canada tools to find or generate spatial display of statistics
What are ‘small area statistics’ about? • High demand for information at the ‘lowest geographic level available’ • Statistics at sub-provincial, or sub-municipality level, are critical to analyses of: • health (e.g. spread of disease), • housing, crime, social issues (e.g. emerging patterns of concern or interest), • emergency preparedness (analysis of this doesn’t work at a whole-municipality level), • market analysis, (why do they want my postal code anyway?) • and much, much more!
Privacy and confidentiality • Keeping the unit of analysis anonymous is a challenge with small area information (if one has good local knowledge, you can identify a person) • There are rules in place about what population counts are required in order for small area statistics to be released (e.g. income)
Expense and access • Authoring agencies, because of budget limitations, (‘priorities’) are always balancing availability of variable detail and finer levels of geography
Expense and Access • More variables? > $$$ • Smaller geography? > $$$ !! • No access/distribution infrastructure in place • Simply not available or collected
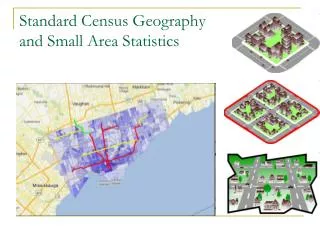
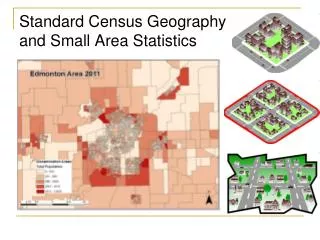
Geographic display • What can a map display do that a listed table cannot? • Summarize the big picture – with a picture • Rapidly show PATTERNS of disparity that might have some unexpected explanation • Allow display of statistics without knowledge of coding structure for viewers
Brief words on: why Geographic Information Systems? • Small area statistics are not easily read in tables • Graphic display becomes much more important at smaller levels • GIS increasingly used as a tool for small-area analysis and summary
Geographic displays of stats always involve choices, too • Simple shade of color choices imply different meanings • Ranges of statistics (‘breaks’ in the data) can be manipulated to imply different things • Statistics can be left out of maps easily; what is missing? • Source statistics may be ‘bad’
Geographic displays of statistics are subject to metadata review • Evaluation of an online map display is as required as an evaluation of statistics via metadata review; metadata criteria also apply to maps (sources should be cited, survey specified; see yesterday’s slide)
The Census Geography Hierarchy • Organizing a national system of statistical reporting depends on a full-coverage nested geographic hierarchy; i.e. geography/GIS for StatsCan is about more than making maps • The hierarchy helps to ensure 100% coverage of the population during Census collection by organizing the country’s geography • The hierarchy also defines ‘level’ of the release of statistics • Small area statistics exist at the ‘bottom’ (yet $$) end of the hierarchy
Great StatsCan Geography Tools for understanding hierarchy Nice quick tutorial: • http://geodepot.statcan.ca/Diss/Reference/Tutorial/HC_tut1_e.cfm Fantastic glossary: http://geodepot.statcan.ca/Diss/Reference/COGG/Index_e.cfm
A brief hierarchy overview • All levels of the hierarchy have definitions and corresponding codes • Eg. Canada – 00; Alberta (Province) – 48 • The levels and codes have defined relationships • Below provinces, we have Census Divisions: eg 4801 • Below provinces, Census Metropolitan Areas and Census Subdivisions • Below those, Census tracts and Dissemination Areas (SMALL AREA STATISTICS)
Hierarchy continued • Hierarchy is defined administratively (ie political decision) and statistically (ie StatsCan’s reporting requirements) • Not everything in the hierarchy relates to every other unit (see chart); i.e. not a straight, linear hierarchy • Eg. Forward Sortation Areas • “Odd” units (to StatsCan): ‘Designated Places’
Hierarchy applied to statistics • Not all statistics are available for all levels of the hierarchy; parts of the hierarchy may not exist in some places • Statistical analysis is more appropriately applied to some units than to others: eg. CMA vs CSD
Hierarchy and Small Area Statistics • What are the important small area statistics in the hierarchy? • Most commonly: Census Tracts and Dissemination Areas
Other small-area data units • What people want re: geography is often not the unit of geographic availability • Data typically compiled into statistics to meet the needs of the authoring organization • Who ELSE cares about these areas/what demands are in place for this information? • Solutions are available! (We’ll look at some)
Neighbourhoods • Frequent need for statistics at this level of geography • Census tracts vs. neighbourhoods • Municipalities: purchasing profiles and sharing agreements
Postal Codes • Frequently requested for market analysis/business applications • Represented graphically by dots in a product called the Postal Code Conversion File (PCCF) • Postal codes are regions! • The PCCF allows matching of postal codes to the best corresponding dissemination area
“Unavailable” Statistics Canada geographic areas • Some data resellers ‘impute’ or calculate estimates of ‘missing data values’ for small area statistics
GeoSuite: Walk-Through Exercise Click-along with Leah!
Exercise: Explore the hierarchy and statistics for your favorite geographic area using StatsCan Tools • Start here: • http://geodepot.statcan.ca/Diss/Maps/Maps_e.cfm • Explore the three sources available and evaluate them for usability, metadata, and for what information they have to offer you: • What were you able to discover about your chosen area from each source? • To what level of geography were you able to reach using each source?