Download
1 / 15
200 likes | 349 Views
This overview of ion implantation explores its significance in semiconductor technology, comparing it to chemical diffusion and highlighting the precision in doping level control. Key aspects include the ability to target specific doping regions, the handling of both p-type and n-type dopants, and methods to recover from implant-induced damage through thermal annealing. We discuss simulation techniques such as Monte Carlo methods, the phases of collision cascades, and depth profiling measurement techniques. Limitations and complexities in the ion implantation process, along with damage models, are also addressed.

E N D
Ion Implantation CEC, Inha University Chi-Ok Hwang
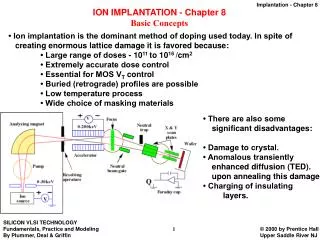
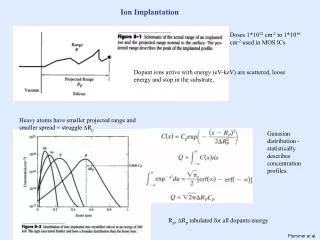
Ion Implantation • Ion implantation (introduced in 1960’s) vs chemical diffusion • High accuracy over many orders of magnitude of doping levels • Depth profiles by controlling ion energy and channeling effects • Dopants into selected regions using masking material • Both p- and n-type dopants • Recovering implant-damaged Si crystalline via thermal annealing • Definition of ion implantation • CMOS energy range: 0.2keV-2MeV
Ion Implantaion • Aspects of ion implantaion: dose, dose uniformity, profiles (depth distribution), damage, damage recovery after annealing • Dose • Limitations -damage to the material structure of the target -shallow maximum implantation depth (1㎛) -lateral distribution of implanted species -throughput is typically lower than diffusion doping processes
Ion Implantation • Ion species and substrate • Tilt and rotation • Ion energy • Dose rate • Results: dopant distribution, defect distribution
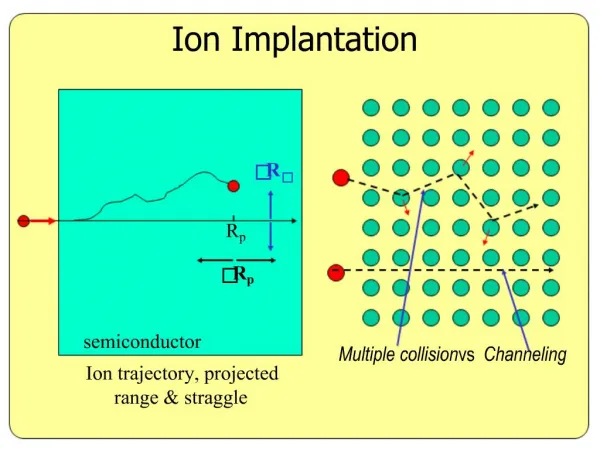
Ion Implantation • Limitations -complex machine operations -safety issue to the personnel • Ion implantation profiles -range, R -projected range, Rp -projected straggle, ΔRp -projected lateral straggle, ΔR⊥
Ion Implantation • Simulation size: cascade size (10-25 cm3 (M.-J. Caturla etc, PRB 54, 16683, 1996) ) - 1000 atoms (J.B. Gibson etc, PR 120(4), 1229, 1960) - a few hundreds of thousands of atoms (J. Frantz etc, PRB 64, 125313 , 2001) • Time scales - thermal vibration periods of atoms in solids: 0.1 ps (10-13 sec) or longer - cascade lifetime: 10 ps (M.-J. Caturla etc, PRB 54, 16683, 1996) - ion implantation (secs; annealing time secs-mins) • Si density: 5 x 10²² /cm3 (5.43Å unit cell, 8/unit cell) • ion dose: 1014 -1018 ions/cm2
Stopping powers • Electric fields; nuclear charge of the silicon atoms (short range interatomic force by screening effect, nuclear stopping) and valence electrons of the crystal (polarizational force, nonlocal electronic force) • exchange of electrons with the silicon atoms (local electronic stopping)
Ion Implantation • ion implantation Potential: BCA - nuclear stopping power; elastic collision Vij(r) = Zi Zje2 /r Φ(r) Φ(r); screening of the nuclei due to the electron cloud ① Thomas-Fermi ② ZBL; universal screening potential - electronic stopping power; frictional force ③ Stillinger-Weber potential
Ion Implantation • Simulations of ion implantation - Full MD - Recoil Interaction Approximation (RIA) (1-100 keV) - BCA: valid for low-mass ions at incident energies from 1-15 keV (M.-J. Caturla, etc, PRB 54, 16683, 1996)
Ion Implantation • Three phases of collision cascade - collisional phase (0.1-1 ps) - thermal spike (1 ns) - relaxation phase (a few thousands of fs) • Measurements of depth profiling - Rutherford Backscattering Spectroscopy (RBS) - Secondary Ion Mass Spectroscopy (SIMS) - (Energy-Filtered) Transmission Electron Microscopy ((EF)TEM)
BCA • Primary recoil atoms, • Binary scattering tables: described by specifying the species involved in the collision, the impact parameter, and the ion energy • Assuming that the potential energy of the ion at the start of the collision is negligible compared to its kinetic energy • Neglecting multi-body interactions
Kinchin-Pease Model • Damage model: damage generation, damage accumulation, defect encounters, amorphization • Number of Frenkel pairs proportional to the nuclear energy loss • Nuclear energy loss is deposited locally and induces local defects • Holds only when the secondary ion’s energy is relatively low • The percentage of the interstitials and vacancies surviving the recombination decreases as the implant energy increases
Kinchin-Pease Model Number of point defects Ed; displacement threshold energy (15 eV) Net increase of point defects N; local defect density Nα; critical defect density for amorphization f; fraction of defects surviving the recombination within one recoil cascade
Kinchin-Pease Model Damage dechanneling; defect encounter probability Amorphization: the critical density is taken to be 10% of the lattice Density for all implant species