Download
1 / 39
390 likes | 410 Views
Explore the impact of the 20km RUC model through detailed statistical results and design of parallel experiments. Learn about the assimilation system, observations used, and model improvements. Discover the significance of TAMDAR data in enhancing forecasting accuracy.

E N D
Stan Benjamin, Bill Moninger, Tracy Lorraine Smith, Barry Schwartz, Brian JamisonNOAA Forecast Systems LaboratoryBoulder, CO GLFE Real-time TAMDAR Impact Experiments with the 20km RUC - August 2005 report
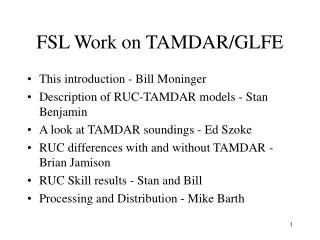
Outline of talk Part 1: General description of RUC 1h cycle - Data assimilated - Spatial effects of assimilated data Design of RUC parallel experiments – Dev / Dev2 New example of Dev/Dev2 difference fields (Brian Jamison) Part 2: Actual statistical results
Purpose for Rapid Update Cycle (RUC) model run operationally at NCEP • Provide high-frequency mesoscale analyses, short-range model forecasts • Use all available observations • Users: • aviation/transportation • severe weather forecasting • general public forecasting • Focus on 1-12 hour forecast range • Accuracy of surface fields very important
RUC Assimilation System Updates 1-h cycle Analysis 3DVAR on q/s surfaces (y/c/Zunb, q, lnQ) Details Balanced height (NMC method) Length-scales modified from OI Sfc Obs/ Use surface obs through PBL PBL Structure Lapse-rate checks Noise Adiabatic digital filter initialization Clouds/Cloud analysis (GOES cloudtop pres, moisture METAR clouds, 1-h forecast background) Cycling of cloud, hydrometeor, land-surface fields
3DVAR 3DVAR 3DVAR 3DVAR 3DVAR Obs Obs Obs Obs Obs RUC Hourly Assimilation Cycle 1-hr fcst 1-hr fcst 1-hr fcst 1-hr fcst 1-hr fcst 1-hr fcst Background Fields Analysis Fields Time (UTC) 11 12 13 14 15 16
12-h fcst 12-h fcst 3DVAR 3DVAR 3DVAR 3DVAR 3DVAR Obs Obs Obs Obs Obs RUC Hourly Assimilation Cycle 9-hr fcst 9-hr fcst 9-hr fcst 9-hr fcst Background Fields Analysis Fields EC Time (UTC) 11 12 13 14 15 16
Cloud anx variables Observations used in RUC Data Type ~Number Freq. -------------------------------------------------- Rawinsonde 80 /12h NOAA profilers 30 / 1h VAD winds 110-130 / 1h Aircraft (V,temp) 1400-4500 / 1h Surface/METAR1500-1700 / 1h Buoy/ship 100-150 / 1h GOES precip water 1500-3000 / 1h GOES cloud winds 1000-2500 / 1h GOES cloud-top pres~10km res / 1h SSM/I precip water 1000-4000 / 6h GPS precip water ~300 / 1h Mesonet ~5000 / 1h -------------------------------------------------- PBL – prof/RASS ~20 / 1h Radar refl / lightning 4 km res -------------------------------------------------- NCEP operational FSL experimental
Application of Digital Filter Initialization in RUC • 45 min forward, 45 min backward – no physics • Average over DFI period
RUC Analysis • 3-d effect of observations dependent on statistically determined forecast error covariance • vertical – dependent on • horizontal – smaller near surface, larger aloft,
RUC20 • Wind forecast • Accuracy • Sept-Dec • 2002 6 9 1 3 12 Analysis ~ ‘truth’ Verification against rawinsonde data over RUC domain RMS vector difference (forecast vs. obs) RUC is able to use recent obs to improve forecast skill down to 1-h projection for winds
Results from fall 2002 – better moisture results in RUC13 Potential for more improvement from TAMDAR – V, T, RH
Upgrades to RUC model 28 June 2005 13-km operational at NCEP Assimilation of new observations - METAR cloud/vis/current weather - Mesonet - GPS precipitable water - Boundary layer profilers, RASS temperatures - Radar data (when available at NCEP) Model improvements – new versions of: - Mixed-phase cloud microphysics (NCAR-FSL) - Grell-Devenyi convective parameterization All upgrades used in 2005 FSL 20-km dev/dev2 RUC versions
Real-time TAMDAR impact experiment design • Parallel 20km RUC 1-h cycles • Dev cycle – all obs data but no TAMDAR • Dev2 cycle – dev + TAMDAR data • Lateral boundary conditions – same for Dev and Dev2 • Control design • Initialize Dev and Dev2 runs at exact same time • Reset dev and dev-2 background field at 1000z every 48 h (even Julian dates) • Ensure against any computer logistics differences • Evolution of dev vs. dev2 is different • Example – buddy check QC in each cycle may occasionally differ for non-TAMDAR data • Slight difference in gravity waves • Can propagate difference throughout domain • Shows up in sfc temps, convection, esp. 925, 850 mb
0900z --------- 1200z • Sunday 10 April 2005 • Reset of dev-dev2 difference at 1000z • by copying Dev RUC 1-h forecast from 0900z as background for Dev2 analysis at 1000z • Reset is effective (although it does not allow accumulation effects of TAMDAR data beyond 48h)
Dev-Dev2 difference – 0h analysis Init 1800z 24 Aug 2005 – 500 mb 1000-1800z
Verification regions for FSL-RUC TAMDAR impact Large region (eastern half of US) -- 38 RAOB sites Small region (Great Lakes) includes 14 RAOBs
Wind forecast ‘errors’ - defined as rawinsonde vs. forecast difference Anx Fit - ‘truth’ Cntl = using all obs Exp = deny profiler obs Difference in errors between Cntl and Exp experiments w/ RUC - 4-17 Feb 2001 Positive difference means CNTL experiment with profiler data had lower error than the EXP-P no-profiler experiment
TAMDAR evaluation phases • Phase 1 – 9 Feb – 21 April 2005 • Winter/early spring – lower vertical resolution • Phase 2 – 22 April – 1 June • Spring – higher vertical resolution • Phase 3 – 2 June – 22 July • Summer – higher vertical resolution • Phase 4 – 23 July – 24 August • Summer – lower vertical resolution
TAMDAR evaluation w/ RUC parallel cycles • Summary evaluation over each of 4 phases • Screened any dates with questionable results • If logs showed missing 1h RUC runs for either dev or dev2 cycles • If dev/dev2 verification stat differences over full national domain for winds > 0.2 m/s averaged over 8 mandatory levels • Results only shown for 00z verification, GtLakes region. Less impact for 12z verif and/or E.US reg.
FSL-RUC TAMDAR impact experiment results • (as of 12 April 2005) • Impact experiments must be conducted such as to show value added to other existing observations • RUC well-suited for this • Real-time parallel cycles at FSL (Dev/Dev2) have provided well-controlled experiments and results • Accelerated evaluation process • Results are very preliminary and during TAMDAR shakedown phase • Temperature impact strongest • ~20% reduction of 3h forecast error • RH impact less but positive • No impact for wind • Diurnal variations – more 3h impact at 00z than 12z • Results will improve with: • Improved TAMDAR data • Future use of reject lists (updated weekly?)
850 mb temp - clear improvement in the small (Gt Lakes) region Phase 1 – Jan-Apr 05
Dev – Dev2 difference in wind error Positive positive impact from TAMDAR assim -- 30% Reduction of 3h fcst err TEMP – 850 mb
Temperature: some improvement for 700 mb, 3-h forecast Phase 1 – Jan-Apr 05
TEMP – 700 mb Phase 3-4 – Jun-Aug 05
Winds: not much difference Phase 1 – Jan-Apr 05
850 mb 700 mb Phase 3-4 – Jun-Aug 05
WIND – averaged over 850-500 mb -- 10% Reduction of 3h fcst err
Relative Humidity: not much difference Phase 1 – Jan-Apr 05
850 mb 700 mb Phase 3-4 – Jun-Aug 05
RH -- 12% Reduction of 3h fcst err
FSL-RUC TAMDAR impact experiment results • (as of 25 August 2005) • Results (TAMDAR impact) have improved during continued TAMDAR shakedown phase • Recent results – June-Aug • Temperature impact strongest at 850 mb • ~15-20% reduction of 3h forecast error • Less positive impact at 700-500 mb • RH impact at 850 mb • ~12% reduction of 3h forecast error • Negative impact at 700-500 mb • Better Temp/RH impact w/ higher vert resolution • Wind impact – averages 10% reduction of 3h fcst errors in 850-700-500mb layer • Diurnal variations – more 3h impact at 00z than 12z • Results should improve further with: • Further improvements in TAMDAR data accuracy • ascent/descent temp biases, wind errs?