Multivariate Probit
Multivariate Probit. An Analysis of Access to Amenities in Delhi’s Slums. Example: Coalmining and Respiratory Symptoms. Ashford and Sowden, Biometrics , 1970 Is there a relationship? Best model? Standard approach: two probit equations Wheezing and years in mine (age)

Multivariate Probit
E N D
Presentation Transcript
Multivariate Probit An Analysis of Access to Amenities in Delhi’s Slums
Example: Coalmining and Respiratory Symptoms • Ashford and Sowden, Biometrics, 1970 • Is there a relationship? • Best model? • Standard approach: two probit equations • Wheezing and years in mine (age) • Breathlessness and years in mine (age) • Does this approach overlook anything?
Coalmining and Respiratory Symptom • Each physiological system has a certain tolerance: tolerance vector • Ashford and Sowden: ignoring important information if you estimate equations separately • Model in spirit of Seemingly Unrelated Regression (SUR)
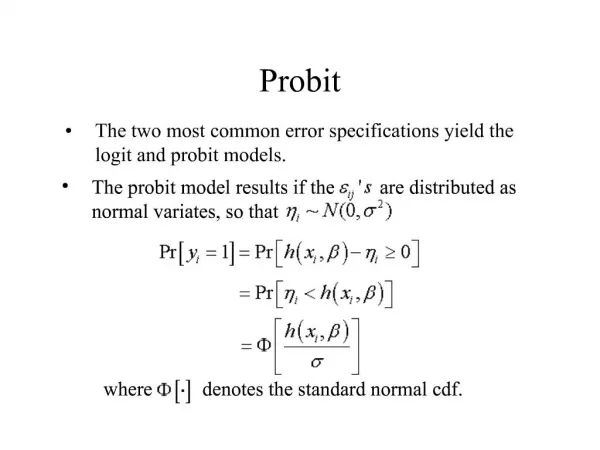
Multivariate Probit (MVP) • Extension of univariate probit (UVP) model • Allows for: • Simultaneous estimation of multiple probit equations • Correlated disturbances across equations
MVP vs. UVP How is it better? • Does not ignore information across equations • Better prediction of conditional and joint probabilities • More consistent estimation • More efficient estimation
Why MVP? • Access to amenities in Delhi slums • Correlation between access to sanitation services and access to drainage for a given household • Separate UVP estimation would ignore this
Where we’re going… • Univariate Probit • Bivariate Probit (i = 2) • Multivariate Probit (i = T) • Delhi Slum Dwellers’ Access to Amenities • Published Applications and Extensions
Univariate Probit Dichotomous dependent variable • Takes on a value of either 0 or 1 • Estimate with OLS?
Linear Probability Model Shortcomings • Cannot constrain probabilities to the 0-1 interval • Negative variances • Heteroscedasticity of ε that depends on X • Logically not attractive Solutions?
Normal Cumulative Distribution Function Properties • Bounded by 0 and 1 • Nonlinear relationship between P and X
Univariate Probit Model y*: latent dependent variable Y: binary dependent variable x: vector of explanatory variables t: standardized normal variable φ: normal pdf β: measures impact of changes in x Φ: normal cdf
UVP Example Y = 1: individual purchased refrigerator in last year Y = 0: individual has not purchased refrigerator in last year X = individual’s income per annum
UVP: Mechanics • Group the data by RHS variable (income) • Calculate Phati for each i grouping of income • For each Phati, use the standard normal cdf to find Ii • Add 5 to each Ii • Use OLS to estimate β1, β2 in:
Two probit equations Y1 = 1: individual purchased refrigerator in last year, 0 otherwise Y2 = 1: individual purchased dishwasher in last year, 0 otherwise X = individual’s income per annum
Bivariate Probit , y 1 = 1 if , 0 otherwise , y 2 = 1 if , 0 otherwise
BVP: Estimation • Maximum Likelihood • Bivariate Normal cdf: where φ2 represents the bivariate normal pdf and:
BVP: Estimation • Probabilities that enter the likelihood function: Φ2: bivariate normal cdf
BVP: Estimation • Function to be maximized:
BVP: Estimation in Practice Simulated Maximum Likelihood • Markov chain Monte Carlo • GHK simulator • Geweke-Hajivassiliou-Keane smooth recursive conditioning simulator • Greene (2003) discusses this in Appendix E • Cappellari and Jenkins (2003)
BVP: Is it Necessary? • H0: ρ = 0 (estimate independent probit equations separately) • Test statistic (Kiefer 1982): LM ~ χ2 with d.f. = (T)(T-1)/2 where T = # of equations
BVP: More Test Statistics z-statistic: Likelihood ratio: j = number of restrictions
BVP: Properties of the Estimator • Considers unobservable heterogeneity • Random components of one equation are allowed to be freely correlated with the random components of the other • Takes into account unobservable characteristics that might affect both dependent variables • More efficient and consistent than separate ML estimation of UVP models • UVP does not account for the correlation between error terms: assumes exogeneity of dep var covariates, so does not give consistent estimates of parameters (Maddala 1983)
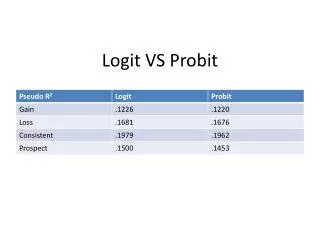
BVP: Measure of Goodness of Fit McFadden’s likelihood ratio index (LRI): • lnL: maximized value of log-likelihood function for specification at hand • lnL0: maximized value of log-likelihood function calculated with only a constant term • Bounded by 0, 1, increases as fit improves
Multivariate Probit yi= 1 if yi* > 0, 0 otherwise, i = 1,…,T and ρii = 1, ρij= ρji for i, j = 1, …, T where
MVP Application: Delhi Slums Delhi slum dwellers’ access to amenities
Delhi Slums Tiebout sorting (Charles Tiebout 1956) • Individuals sort themselves into communities based on preferences of provisions of public goods • Assumptions • Unlimited mobility • Unrestricted number of communities • Implication: Heterogeneous preferences
Delhi Slums Heterogeneity in community composition • Impact on economic outcomes • Reduced participation to secure community grants in US (Vigdor 2004) • Decreased maintenance of infrastructure projects in Pakistan (Khwaja 2001) • Less spending on education, sewers, roads in US (Alesina et al 1999) • Slower growth in Sub-Saharan Africa (Easterly and Levine 2003) • Channels?
Delhi Slums: Model (Alesina et al 1999) Model: • g*: amount of public good provided in equilibrium • : median distance from the type of public good most preferred by the median voter • α: parameter from individual’s utility function (0<α<1) • Punchline: g* and are inversely related:
Delhi Slums: H0 and H1 H0: Public goods provision is not affected by the degree to which preferences are polarized H1:Public goods provision is negatively affected by polarization of preferences
Delhi Slums: Public Goods Provision of public goods is a latent variable • Proxy with access to public goods • Medical facilities (MED) • Sanitation services (SAN) • Drainage (DRA)
Delhi Slums: Fractionalization Proxies for Fractionalization • Religion • Hindu • Muslim • Sikh • Caste • Backward castes and tribes • Scheduled castes and tribes • General Hindu • Muslim, Sikh, other
Delhi Slums: Econometric Model • : amount of public good a (latent) accessible by slum dweller i • Map to the observed realizations: 1 represents access, 0 otherwise if , 0 otherwise • Lose information
Delhi Slums: Econometric Model Assumption: where UVP:
Delhi Slums: Econometric Model X vector: • Religious fractionalization (frd) • Caste fractionalization (fcd) • Per capita household income (pcinc) • Education dummies (edu1, edu2, edu3) • Mean-to-median income ratio (mminrat) • Poverty dummy (poor) • Political participation dummy (political) • Years in community (yrincomm) Proxies for lhatm
Delhi Slums: MVP vs. UVP Is MVP necessary? • H0: ρMS = ρMD = ρSD = 0? • Stata reports the LR test statistic = 37.78 ~ χ2(3), so reject H0 • Yes, MVP is an improvement on UVP • Not ignore information contained in covariance matrix • goodness of fit:
Future Research Dependent variable • More direct measure for spending Panel data • Changes in income v changes in fractionalization Semiparametric and nonparametric techniques • Horowitz and Savin (2001) • Single-index modeling • Median regression approach
MVP in Practice Ashford and Sowden (1970) Zhao, X. and M. Harris (2004) “Demand for Marijuana, Alcohol and Tobacco: Participation, Levels of Consumption and Cross-equation Correlations,” The Economic Record, 80(251): 394-410. Greene, W. (1998) “Gender Economics Courses in Liberal Arts Colleges: Further Results,” The Journal of Economic Education, 29(4): 291-300. Christofides, L., T. Stengos, and R. Swidinsky (1997) “Welfare Participation and Labour Market Behavior in Canada,” The Canadian Journal of Economics, 30(3): 595-621.
References Alesina, A., R. Baqir, and W. Easterly (1999) “Public Goods and Ethnic Divisions”, The Quarterly Journal of Economics, 114(4): 1243-1284. Ashford, J.R. and R.R. Sowden (1970) “Multi-variate Probit Analysis,” Biometrics, September: 535-546. Cappellari, L. and S.P. Jenkins (2003) “Multivariate probit regression using simulated maximum likelihood,” Stata Journal, 3(3): 221-235. Easterly, W., and R. Levine (1997) “Africa’s Growth Tragedy: Policies and Ethnic Divisions,” Quarterly Journal of Economics, 112(4), 1203-1250. Greene, W. (2003) Econometric Analysis (Fifth Edition), Delhi: Pearson Education.
References (cont.) Horowitz, J. and N.E. Savin (2001) “Binary Response Models: Logits, Probits and Semiparametrics,” Journal of Economic Perspectives, 15(4): 43-56. Kiefer, N. (1982) “Testing for Dependence in Multivariate Probit Models,” Biometrika, 69(1): 161-166 Khwaja, A.I. (2001) “Can Good Projects Succeed in Bad Communities? Collective Action in the Himalayas,” John F. Kennedy School of Government Faculty Research Working Paper Series RWP01-043. URL: http://ssrn.com/abstract=295571 Maddala, G.S. (1983) Limited Dependent Variables in Econometrics, Cambridge: Cambridge University Press.
References (cont.) Tiebout, C. (1956) “A Pure Theory of Local Expenditures,” Journal of Political Economy, 64(5): 416-424. Vigdor, J. (2004) “Community Composition and Collective Action: Analyzing Initial Mail Response to the 2000 Census,” The Review of Economics and Statistics. 86(1): 303-312.