Download
1 / 17
170 likes | 253 Views
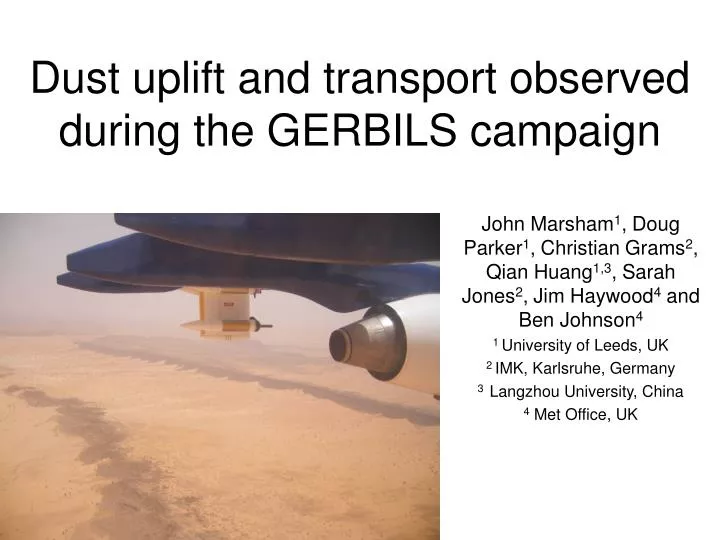
Dust uplift and transport observed during the GERBILS campaign. John Marsham 1 , Doug Parker 1 , Christian Grams 2 , Qian Huang 1,3 , Sarah Jones 2 , Jim Haywood 4 and Ben Johnson 4 1 University of Leeds, UK 2 IMK, Karlsruhe, Germany 3 Langzhou University, China 4 Met Office, UK.

E N D
Dust uplift and transport observed during the GERBILS campaign John Marsham1, Doug Parker1, Christian Grams2, Qian Huang1,3, Sarah Jones2, Jim Haywood4 and Ben Johnson4 1 University of Leeds, UK 2 IMK, Karlsruhe, Germany 3 Langzhou University, China 4 Met Office, UK
GERBILS (GERB Intercomparison of Longwave and Shortwave radiation) Model – GERB outgoing longwave 0 10 20 30 40 50 • Model emits 50Wm-2 too much outgoing infared (Jim Haywood, Met Office)
Windspeed3 Dust uplift rate ~550 hPa Shear stress at surface (~near surface windspeed) “Probably the best dry-adiabat in the world” Motivation • Unique, deep (~5 km), near-neutral boundary layer. • Poorly represented by models? Certainly poorly observed. • Dust uplift a non-linear function of windspeed. • Saharan Heat Low.
The Saharan boundary-layer • Observations suggest occasional complete vertical mixing . • Saharan Air Layer (SAL) allows dust to avoid rain-out. • Models are not designed for such deep boundary layers (BL scheme of HadGAM was switched off above 2880 m) Free troposphere ~5 km Near neutral residual layers Active well mixed boundary layer
Mixing from the boundary layer into the residual layer (Parker et al) Free troposphere Residual layer Active boundary layer Orography Albedo anomalies Deep dry convection Isentropic upgllide
Land-atmosphere coupling Low albedo High land surface temperature High boundary-layer air temperature Low water vapour Aircraft observations from GERBILS • Is this statistically significant? (Marsham et al submitted to ACPD)
Cospectral analysis Relationship of variables with land surface temperature (LST) as a function of scale Along track wind BL buoyancy BL WVMR BL windspeed Convergence towards warm BL over dark surfaces for scales > 10 km.
Implications for the SAL • SAL weakly stratified, so small perturbations in BL buoyancy are expected to affect vertical mixing. • Large eddy modelling of this is ongoing work. ~ 4 K (Marsham et al submitted to ACPD)
Boundary-layer convection and dust uplift • Boundary-layer convection contributes to uplift (especially if speed of mean wind ~ the uplift threshold). Uplift rate with and without resolved large eddy model winds Mean wind = 9.9 m/s Mean wind = 4.9 m/s
Observations of dust in cold pools (“haboobs”) 1200 UTC Cold pool outflows
What are the implications? • Engelstaedter and Washington (2007) showed that: • Dustiness associated with convergence at head of monsoon. • Dustiness depends on gustiness more than synoptic-scale winds (Engelelstaedter and Washington, 2007) • Dustier in monsoon onset than retreat. Why? • Sterk 2003, Williams (2006), Bou Karam et al 2007, Flament et al 2007 • All show dust uplift by cold pools in this region at this time (also Sutton 1925, 1931 for the Sudan)
Annual cycle of dust and cold pools TOMS • Energy available to downdraughts (DCAPE) shows same asymmetry as TOMS Aerosol Index. (Marsham et al submitted to JGR)
Can this be explained by other annual cycles? • CAPE and deep convection do not show asymmetry. (Marsham et al submitted to JGR)
Can this be explained by other cycles? • Soil moisture and vegetation are only significant in the south. (Marsham et al submitted to JGR)
Conclusions • Saharan boundary layer is unique • Deepest dry convection on Earth • Poorly observed. Poorly modelled? • Mesoscale processes affect (control?) mixing between boundary layer and the SAL. • Dust uplift is a function of local windspeeds. • Boundary-layer convection affects dust uplift. • Downdraughts from storms are one of the major processes causing dust uplift in the western Sahara. • Must represent these, and so the monsoon flow, in dust models.