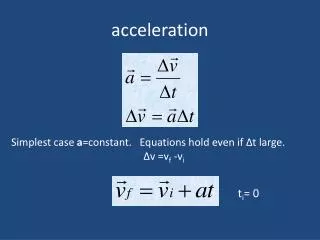
Incline Experiment: Observing Object Speed Change
This experiment involves observing how the speed of an object changes as it moves down an incline. By altering the ramp height and recording data, students will analyze distance vs. time and velocity vs. time graphs to understand acceleration. Explore how the marble's speed changes and interpret graph shapes to determine acceleration patterns. Gain insights into calculating slopes and their significance in velocity data interpretation.

Incline Experiment: Observing Object Speed Change
E N D
Presentation Transcript
Purpose: To observe the speed of an object as it moves down an incline. Procedure: Elevate one end of a track by placing a certain number of books under it. Identify and mark a starting point. Release a marble down ramp and start the timer. Mark the position of the marble every second for up to four seconds. Repeat this procedure twice more at this height. Change the height of your ramp and repeat the entire experiment. Record your data in the data table provided. Safety: Data:
Analysis- For each data table, make a graph of distance vs. time and of velocity vs. time. Plot the data of distance vs. time on one graph and the data of velocity vs. time on another graph. Color code the graphs to distinguish height #1 from height #2. Conclusion- 1. Did the marble speed up, slow down, or maintain the same speed as it traveled down the ramp? What was the shape of your distance vs. time graphs? What was the shape of your velocity vs. time graphs? At which height did your marble move the fastest? How can you tell? Find the slope of the line using your velocity vs. time graphs. Show how you calculated the slope of your line. What does the slope of your line represent?