Atomic-Detail Computer Simulation
Model System. Atomic-Detail Computer Simulation. Molecular Mechanics Potential. Energy Surface Exploration by Simulation. Lysozyme in explicit water. Model System set of atoms explicit/implicit solvent periodic boundary conditions Potential Function empirical chemically intuitive

Atomic-Detail Computer Simulation
E N D
Presentation Transcript
Model System Atomic-Detail Computer Simulation Molecular Mechanics Potential Energy Surface Exploration by Simulation..
Model System • set of atoms • explicit/implicit solvent • periodic boundary conditions • Potential Function • empirical • chemically intuitive • quick to calculate Tradeoff: simplicity (timescale) versus accuracy
2/8 MM Energy Function f q l r q q j i
Electrostatic interaction potential energy between two like-charged atoms. A particular value of rijspecifies the configuration of the system. In the above case one coordinate (degree of freedom) suffices to define the configuration of the system.
first approximation - a molecule will tend to minimize its potential energy. kl = force constant lo=equilibrium value
Each different potential energy minimum defines a separate conformation of the molecule.
2/8 MM Energy Function f q l r q q j i
Molecular Mechanics Force Field CHARMM Energy Function:
Crystal structure of L-Leu-L-Val methanol solvate showing methanol-peptide group hydrogen bonding. (From C. H. Görbitz and E. Torgersen Acta Cryst. (1999). B55, 104-113).
Determining Parameters experimental data ab initio results • X-ray and neutron scattering crystal structures • vibrational frequencies (IR-Raman) • NMR measurements • crystal lattice constants • Hessian matrix elements normal modes • forces • energy barriers • electrostatic potential
Determining Force Constants (k2) Infrared spectrum of arginine. The frequency is given in wavenumbers. (From Chapo, C. J.; Paul, J. B.; Provencal, R. A.; Roth, K.; Saykally, R. J. J. Am. Chem. Soc. 1998, 120, 12956-12957.)
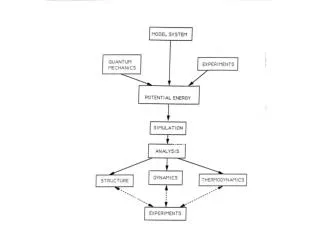
Basics of Quantum Chemistry. Schrödinger equation: H=E where E is the energy of the system, H is the Hamiltonian operator, H=T+V. V=Vnn+Vne+Vee. Born-Oppenheimer Approximation Potential Energy Surface.
2 x 10²⁰ years bR time ~ N6 3 Mio years 1 year 1 month Ne Ne2 12 hours Size 30 100 000 10 100 1 000 10 000 Number of Electrons (N)
Quantum-chemically optimized structure of a fluorescent probe: Rhodamine 6G.
Case Study: Cholesterol • Regulates: • membrane fluidity • membrane permeability • lateral mobility of proteins Cholesterol (~ 40%) in plasma membrane
Normal Mode Analysis Approximate the complex energy landscape by harmonic potentials MM QM Force Constant Matrix: Hessian at the energy minimum vibrational frequencies energy Normal Modes eigenvectors internal motions Water Normal Modes
Automated Frequency Matching Method for Parameter Development* • Fitting the molecular mechanics potential (CHARMM): • vibrational frequencies • eigenvector projections From quantum chemical calculations NWChem - DFT (B3LYP) • Frequencies AND the sets of eigenvectors should coincide * A.C. Vaiana et al., J.Comput.Chem., 24: 632, 2003
Automated Frequency Matching (2) 1) Project the CHARMM eigenvectors onto the reference NWChem Projection: CHARMM eigenvectors: NWChem eigenvectors: Frequency corresponding to max. projection: Ideal case: 2) Minimize Merit Function: 3) Results are iteratively refined to fit the results of the quantum chemical normal mode calculations • Refinement of parameter set: Monte Carlo Algorithm • Optimizations performed separately for bond, angle, torsion and improper constants • VDW parameters were not optimized
Starting parameters • Convergence criterion: • 2.500 steps of constant Y2 Run NMA in CHARMM Change Parameters Compare MM and QM NMA results N Check for converg. Y STOP Calculate Y2 Y2newY2old Y Keep new parameters N Keep old parameters
Results Root Mean Square Deviation: Fig. The line is the ideal case of perfectly matched frequencies and eigenvector projections ; points refer to optimized parameters • overall agreement of CHARMM and quantum chemical normal modes • biologically relevant modes (low frequencies) are well reproduced
Calculating the Point Charges • not within atom radius - unrealistic charge • not too far away from the molecule calculate the potential on a grid • Constraints: • sum of the charges equal to zero • grouping in subsets of atoms constrained to have zero charge • Basis Set: 6-31G* • Method: CHELPG
The electrostatic potential (r) at a point r is defined as the work done to bring a unit positive charge from infinity to the point. The electrostatic interaction energy between a point charge q located at r and the molecule equals q(r). Electrostatic potential mapped onto the electron density surface for 2-bromo-2-chloro-1,1,1-trifluoroethane (halothane). (From: Pei Tang, Igor Zubryzcki, Yan Xu J comp chem. 22 436 (2001)).
Quantum Chemistry X-Ray Electron density in the peptide bond plane of DL-alanyl-methionine (from Guillot et al Acta Cryst B 57(4) 567 (2001)).
Experimental. Theoretical. Electrostatic potential generated by the NADP+ cofactor in the plane of the nicotinamide ring an aldose reductase complex. Blue, positive; red, negative; black dotted line, zero level. (From Nicolas Muzet , Benoît Guillot, Christian Jelsch, Eduardo Howard and Claude Lecomte PNAS 2003 | vol. 100 | no. 15 | 8742-8747)
Transition state structure for the catalytic mechanism of a Tyrosine Phosphatase calculated using Density Functional Theory (From Dilipkumar Asthagiri, Valerie Dillet, Tiqing Liu, Louis Noodleman, Robert L. Van Etten, and Donald Bashford J. Am. Chem. Soc., 124 (34), 10225 -10235, 2002.)
f Rotational Barrier C2 O C3 H cyclohexanol
Rotational Barrier of H – O – C3 – C2 dihedral k n CTL2 CTL1 OHL HOL 0.23 3 0.00 HAL1 CTL1 OHL HOL 0.23 3 0.00 HAL1 CTL1 OHL HOL 1.3 1 180.00 (Kept fixed during optimization)
Crystal Simulation • Crystal Symmetry: P1 • 2ns MD simulation of single cholesterol molecule to ensure that stereochemistry is preserved • 2ns MD of crystal • Calculation of RMSD … Superposition of the experimental and the CHARMM minimized structures for an individual cholesterol molecule The experimental unit cell
RMSD Calculations Mean Rmsd = 0.617 Mean Rmsd = 0.973 Rmsd calculated over the whole trajectory including all atoms Rmsd calculated over the whole trajectory including atoms with B factors < 10 Å2 Mean Rmsd = 0.195 Mean Rmsd = 0.069 Rmsd comparing 1 averaged cholesterol molecule (from the crystal structure) with the averaged cholesterol from trajectory Rmsd comparing 1 averaged cholesterol molecule (from the crystal structure) with the averaged cholesterol from trajectory, incl. only atoms with B factors < 10 Å2
Application: Cholesterol in Biomembrane Simulations Structural Analysis • organization in membrane • interactions with lipids • H bonding Dynamical Analysis • motion of cholesterol • influence on lipid dynamics • diffusion