Download
1 / 39
390 likes | 539 Views
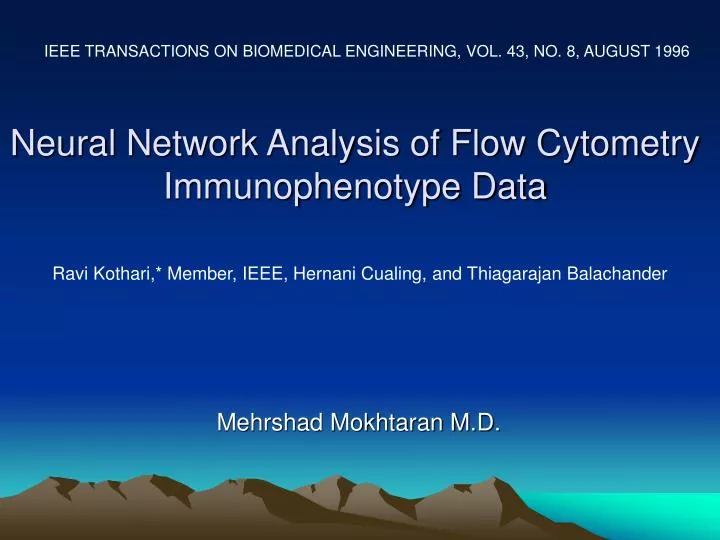
IEEE TRANSACTIONS ON BIOMEDICAL ENGINEERING, VOL. 43, NO. 8, AUGUST 1996. Neural Network Analysis of Flow Cytometry Immunophenotype Data. Ravi Kothari,* Member, IEEE, Hernani Cualing, and Thiagarajan Balachander. Mehrshad Mokhtaran M.D. Acute Leukemia. Definition Malignant Event

E N D
IEEE TRANSACTIONS ON BIOMEDICAL ENGINEERING, VOL. 43, NO. 8, AUGUST 1996 Neural Network Analysis of Flow Cytometry Immunophenotype Data Ravi Kothari,* Member, IEEE, Hernani Cualing, and Thiagarajan Balachander Mehrshad Mokhtaran M.D.
Acute Leukemia • Definition • Malignant Event • Replace the bone marrow with blast • Clinical Complication: Anemia, Infection, Bleeding • Rapidly fatal • With appropriate therapy, the natural history can be markedly altered, and many patient can be cured.
Acute Leukemia • Etiology: • Radiation • Oncogenic Viruses • Genetic and Congenital Factors • Chemical and Drugs
Acute Leukemia • Incidence: • Annual new case (All Leukemia): 8 to 10 per 100,000. • Remained static over the past three decades. • ALL:11% CLL:29% AML:46% CML:14% • 3% of all cancer in United States • ALL is most common cancer in children(<15y) • ALL is second cause of death in children(<15y) • ALL has tow maximum incidence per age • AML gradually increases with age • Half of AML cases occur in patients younger than 50 y
Acute Leukemia • Pathophysiology:
Acute Leukemia • Classification • Morphology • Cytochemistry • Cell-surface markers • Cytoplasmic markers • Cytogenetics • Oncogene expression
Acute Leukemia • Must important Distinction is between: AML & ALL • Clinical behavior, prognosis, response to therapy • AML (FAB) • M0, M1, M2, M3: Increasing degree of differentiation • M4, M5: Monocytic lineage • M6: Erytroid cell linage • M7: Acute Megakaryocytic Leukemia • ALL (FAB) • L1 • L2 • L3
Acute Leukemia • Cell-surface Markers: • AML • Normal immature myeloid cells and blast cells from most patient with AML: CD13, CD14, CD33, CD34 • M6, M7: Antigens restricted to red cell and platelet lineage • AML may express: HLA-DR antigen • 10-20%: B- or T-cell lineage • ALL • 60% of ALL: CALLA(CD10) (early pre-B-cell differentiation state) • Pre-B-cell ALL: 20% CALLA-positive that have intracytoplasmic immunoglobulin • B-cell ALL(5%): Immunoglobulin on cell surface • T-cell ALL(20%): CD5, CD3 or CD2 (normal early T-cell) • Null cell ALL (15%): Fail to express CALLA, B- , T-cell markers • 25% of ALL: Myeloid antigens
Acute Leukemia • Cytogenetics and Molecular biology:
Acute Leukemia • Clinical Manifestations: • Decreaseing normal marrow function: • Anemia: Fatigue, pallor, headache, angina or heart failure • Thrombocytopenia: Bleeding(petechiae, ecchymosess, bleeding gums, epistaxis) • Granulocytopenic(AML>ALL) : Infections (Bacterial) • Invasioning of normal organs by leukemic blasts (ALL>AML): • Enlargement of lymph nodes, liver, spleen • Bone pain • Skin (Leukemia cutis) • Leukemic meningitis: Headache, nausea • CNS (particular in relapse): palsies and seizures • Testicular involvement (particular in relapse) • Any soft tissue (AML>ALL): Chloroma, myeloblastoma • Specific subtype of leukemia: • M3: DIC (Disseminated intravascular coagulation)
Acute Leukemia • Laboratory Manifestations: • CBC • Bone marrow aspiration and biopsy • PT (Prothrombin Time) & PTT (Partial Thromboplastin Time) • LDH (Lactate dehydrogenase) • …
Acute Leukemia • Treatment: • Combination Chemotherapy • Bone Marrow Transplantation • Stabilization: • Hematological • Metabolical • Psychological
Introduction • Data Collection • Classifier Design • Results • Discussion • Conclusion
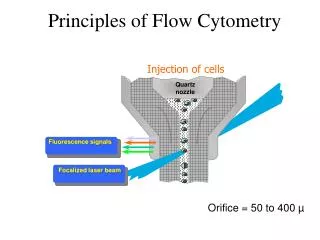
Introduction • Immunophenotype data • Flow cytometry • Lineage & Differentiation • ALL: Immature (CALLA+), Pre-B, Mature-B, T-Lymphoblastic • Response to chemotherapy • AML: M1,M2,…,M8 • No relevant prognosis
Data Collection • Flow cytometry immunophenotype data of cases with leukemia or reactive bone marrow were collected retrospectively from computerized archival database. • Selection Criterion: • Confirmed diagnosis • Complete flow cytometry antibody panel result • Total cases: 170 • 151 leukemia and 19 nonleukemia • 62 children and 89 adults • 81 males and 70 females
First Phase • Lineage Categories • Categorize into: • Reactive • ALL • Remission • Mixed AML-ALL • AML
Second Phase • Categorize the ALL Cases into subcategories based on differentiation • Categorize into: • Pre-B • CALLA+ • T Phenotype • Not include: Mature-B (Difficulty in obtaining sufficient data for meaningful interpretation)
Data • Validation / Training set size = 33-50% • Only Bone marrow phenotypes (Most Sensetive specific) • Excluded: Peripheral blood and cerebro-spinal fluids immunophenotype • Flow cytometry immunophenotype data: • Mean fluorescence intensity of a minimum of 10000 cells analyzed using either a red or green fluorescence tagged antibody
Data • 27 Standardized and most commonly used monoclonal antibodies with defined specificities. • Not all of these are utilized for each case. • Average of 15 antibodies for each case. • At least ten antibodies are commonly used for acute leukemia as a standard practice. • With a zero value if an antibody was not used • An additional binary input denoting past diagnosis of leukemia, were used as input a neural network classifier.
Classifier Design • A feed-forward neural network • Trained using back propagation algorithm
Classifier • How many hidden layer neurons are needed for a particular task? • Having a large number of redundant weights leads to over fitting
Classifier • Given a network with a certain number of inputs, hidden layer neurons, and output, how many training sample are neededto achieve good generalization? • For accuracy of (1-ε): p ≥ O(W/ε) p: Number of training sample. W: Total number of weights in the network.
Classifier • Perturbation: To generate a large number of cases by introducing small variation in actual cases. • Optimal Brain Damage: The weight which least increase the error can be eliminated • Optimal Brain Surgeon: The sensitivity of an interconnection is expressed as the cumulative sum of the changes experienced by a weight, during training. • Weight Decay: Each weight has a tendency to decay to zero with a rate proportional to the magnitude of the weight.
Classifier • Inputs: 27 + 1 • Hidden: 50 Progressively increasing the number of hidden neurons until acceptable performance was achieved on training data. • Output: • First phase (Based on lineage): 5 • Second phase (Based on differentiation): 3 • Learning rate (η): 0.1 • Weight Decay Coefficient (λ): 0.05
Results • Mean error was acceptably low (0.0001) in both the cases. • First phase weights : • Total: 1650 • Nonzero: 1106 • Very small value(<0.1): 544 • Second phase weights : • Total: 1550 • Nonzero: 446 • Very small value(<0.1): 1104
Fig. 2. Performance of the network for categorization into reactive and the lineage categories of leukemia (ALL, Remission, Mixed AML-ALL, and AML).
Fig. 3. Performance of the network for categorization of ALL cases into subcategories based on differentiation (Pre-B, CALLA+, and T Phenotype).
Result • Generalization Error: • First phase: 10.3% • Second phase: 10.0% • Back propagation without the complexity regulation term (Weight Decay): • Generalization performance was poor
Discussion • Clustering-based methods fall into one of two categories: • Partitioning • Hierarchical
Discussion • Partitioning: • e.g., k-means, c-means fuzzy clustering • Divide the inputs, so that members of a cluster are close to each other and far away from other clusters • The shared specificity of some monoclonal antibodies make this extremely difficult.
Discussion • Hierarchical: • e.g., centroid sorting, linkage methods • Try to merge two closest data points together at each step, and repeat the process until there is only one cluster. • Have a better chance of succeeding due to the variability in immunophenotype data • An error in merging made earlier on is propagated throughout.
Conclusion • Off line retraining • Extract rules from trained networks