Download
1 / 6
60 likes | 167 Views
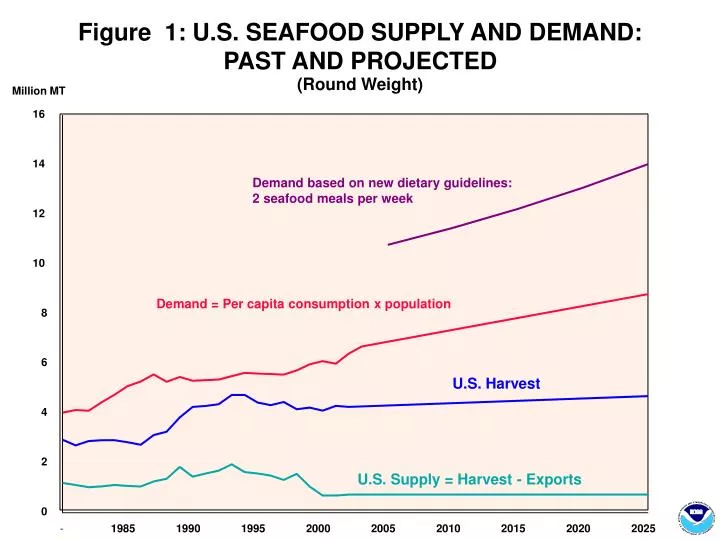
Figure 1: U.S. SEAFOOD SUPPLY AND DEMAND: PAST AND PROJECTED. (Round Weight). Million MT. 16. 14. Demand based on new dietary guidelines: 2 seafood meals per week. 12. 10. Demand = Per capita consumption x population. 8. 6. U.S. Harvest. 4. 2. U.S. Supply = Harvest - Exports. 0.

E N D
Figure 1: U.S. SEAFOOD SUPPLY AND DEMAND: PAST AND PROJECTED (Round Weight) Million MT 16 14 Demand based on new dietary guidelines: 2 seafood meals per week 12 10 Demand = Per capita consumption x population 8 6 U.S. Harvest 4 2 U.S. Supply = Harvest - Exports 0 - 1985 1990 1995 2000 2005 2010 2015 2020 2025
Figure 2: GLOBAL SEAFOOD PRODUCTION - Global and US wild catch stable - Aquaculture production growing Million MT Million MT 100 70 WORLD WILD CATCH WORLD AQUACULTURE PRODUCTION 60 80 50 60 40 World (excluding US) 30 United States 40 20 20 10 0 0 '75 '80 '85 '90 '95 '05 '50 '55 '60 '65 '70 '75 '80 '85 '90 '95 '00 '05 '70 '00
Figure 3: Global Fisheries and Aquaculture Production 180 Capture 160 Aquaculture 140 120 100 80 60 40 20 0 '71 '75 '80 '85 '90 '95 '00 '05 Source: FAO FishStat
Table A: PER CAPITA CONSUMPTION OF TOP TEN SPECIES '91 /// '00 '01 '02 '03 '04 '05 '06 Shrimp 2.40 /// 3.20 3.40 3.70 4.00 4.20 4.10 4.40 Tuna (canned) 3.60 /// 3.50 2.90 3.10 3.40 3.30 3.10 2.90 Salmon 0.97 /// 1.58 2.02 2.02 2.22 2.15 2.43 2.03 Pollock 0.99 /// 1.59 1.21 1.56 1.71 1.28 1.47 1.64 Tilapia /// 0.35 0.32 0.53 0.70 0.85 1.00 Catfish . /// 1.08 1.15 1.10 1.14 1.09 1.03 0.97 Crab 0.32 /// 0.38 0.44 0.55 0.61 0.63 0.64 0.66 Cod 1.12 /// 0.75 0.56 0.66 0.64 0.60 0.57 0.51 Clams 0.58 /// 0.47 0.47 0.57 0.54 0.47 0.44 0.44 Scallops 0.25 /// 0.27 0.33 0.31 Flatfish 0.38 /// 0.42 0.39 0.40 0.33 0.37 Note: Items in red are increasingly derived from aquaculture
Figure 4: U.S. SEAFOOD SUPPLY $ Billion 16 U.S. SEAFOOD EXPORTS AND IMPORTS - Seafood trade deficit grows to over $9 billion in 2006 - Import increases largely of aquaculture products - Increased worldwide demand may drive prices up - Reliance on imports will continue to increase unless domestic production increases 14 12 10 8 6 4 2 0 84 85 86 87 88 89 90 91 92 93 94 95 96 97 98 99 00 01 02 03 04 05 06 Exports Imports SOURCE: DOC, U.S. Bureau of the Census
Figure 5: GLOBAL SALMON PRODUCTION, 1970 - 2005 Thousand MT 2500 Wild Pacific Wild Atlantic 2000 Farmed Pacific Farmed Atlantic 1500 1000 500 0 '90 '70 '75 '80 '85 '95 '00 '05 SOURCE: FAO FishStat