Download
1 / 36
360 likes | 462 Views
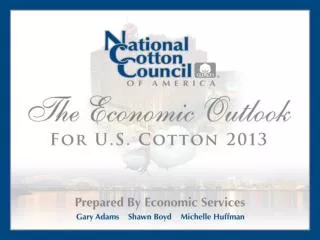
Discover insights into the global cotton market trends for 2013. Analyzing the World, Real GDP growth, IMF data, and NCC Acreage Survey results, including market signals and predictions for U.S. cotton and other crops.

E N D
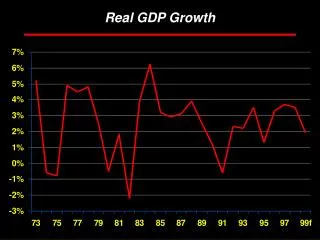
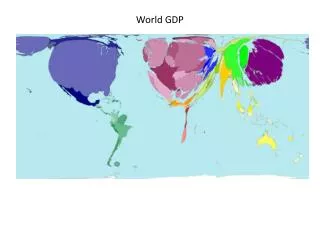
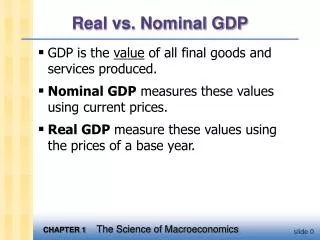
World Real GDP Growth IMF, January 2013
NCC Acreage Survey • Distributed on Dec 18 • Responses collected through Jan 23 • Asked for acres of upland cotton, ELS cotton, corn, soybeans, wheat, Other crops in ‘12 and intentions for ’13; also asked price expectations
2013 Southeast Acreage Total may not add due to rounding.
2013 Mid-South Acreage Total may not add due to rounding.
2013 Southwest Acreage Total may not add due to rounding.
2013 West Acreage Total may not add due to rounding.
2013 ELS Acreage Total may not add due to rounding.
U.S. Cotton Production 13.30 12.86
U.S. Balance Sheet Million Bales
U.S. Balance Sheet Million Bales
China’s Reserves: The Big Unknown Million Bales
U.S. Balance Sheet Million Bales
World Balance Sheet Million Bales
Cotton Trade Balance Million Bales
Summary Points • Resistance breaking out of recent price range • China reserves a key factor • Sustaining demand • Smaller U.S. acreage & production in ‘13 • Remember: $6 corn & $13 soybeans resulted from severe drought; markets could change quickly • ‘14 could look much different
Growth in China Fiber Mill Use? China’s 5-Year Plan