Download
1 / 40
410 likes | 616 Views
Sustainable Governance Indicators. Keryn Paviour -Smith Wednesday 6 June, 2012. Agenda. Introduction Approach and Methodology SGI Ranking 2011 Status Index Management Index Social Justice Index Conclusions. Introduction - starting point for SGI.

E N D
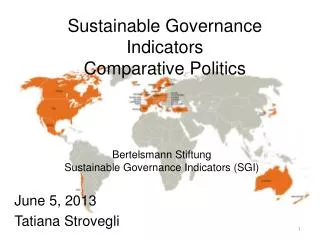
Sustainable Governance Indicators KerynPaviour-Smith Wednesday 6 June, 2012 comparative politics
Agenda • Introduction • Approach and Methodology • SGI Ranking 2011 • Status Index • Management Index • Social Justice Index • Conclusions comparative politics
Introduction - starting point for SGI • All developed industrial countries face several major reform challenges in 21st century: • Economic globalization; • Climate change; • Resource depletion; • Aging societies; • Immigration; • Security threats. comparative politics
Introduction - history of SGI • Bertelsmann Stiftung Sustainable Governance Indicators (SGI) • Started in 2009 • Updated every 2 or 3 years • Ranks SGI in 31 member states in the OECD • Ranks on a scale of 1 (low) to 10 (high) • Ranks along two main indices: • Status Index • Management Index comparative politics
Agenda • Introduction • Approach and Methodology • SGI Ranking 2011 • Status Index • Management Index • Social Justice Index • Conclusions comparative politics
Approach and methodology – combines empirical and qualitative data • SGI are based on sound data capture and aggregation methods. • SGI comprise a combination of qualitative and quantitative data. • Pairs “objective” quantitative data with “highly context-sensitive”, qualitative expert assessments. comparative politics
SGI Methodology comparative politics
Approach and methodology - SGI incorporates a two tiered system of measuring reform..... comparative politics
Status Index comparative politics
Management Index comparative politics
Approach and methodology • Each policy area is evaluated by experts for each country. • Have selected performance indicators that: • Are not ambiguous; • Are available for all OECD countries. • Tries to avoid including model-specific indicators that might be seen as being biased in favour of particular types of economies. • SGI tries to provide a composite image of a country’s performance across various policy areas. • Status Index also includes a few indicators that describe changes over time rather than levels (e.g. inflation rate). comparative politics
Agenda • Introduction • Approach and Methodology • SGI Ranking 2011 • Status Index • Management Index • Social Justice Index • Conclusions comparative politics
Distribution of OECD Countries surveyed comparative politics
SGI Ranking 2011 comparative politics
Overview of the findings • Top rankings of the Status Index are dominated by northern European countries. • However leading group also includes New Zealand and Switzerland, two nations with different political and state welfare traditions. • The group of mid-range scorers (Canada, Australia, Germany, Iceland, Luxembourg, Netherlands, USA, Ireland, Great Britain, Belgium, Austria, Czech Republic, France, Portugal, Japan, Chile, Spain, and Poland) and the lowest-ranking group (South Korea, Italy, Slovakia, Mexico, Greece, and Turkey) are geographically and culturally just as heterogeneous as the top group. comparative politics
Agenda • Introduction • Methodology • SGI Ranking 2011 • Status Index • Management Index • Social Index • Conclusions comparative politics
Status Index - approach • The Status Index aims to compare : • Quality of Democracy; • Policy Performance. • Presumed that a high quality of democracy is necessary for the long-term stability of a political system and sustainable policies. comparative politics
Quality of Democracy vs. Policy Performance comparative politics
Quality of Democracy - findings • Norway, Sweden, New Zealand and Finland receive top scores on quality of democracy. • Membership in the European Union seems to exert a positive influence on the protection of civil rights: Hungary, Italy, Slovakia and Greece score better here than South Korea, Mexico and Turkey. • The main shortcomings of Turkish policy are restrictions on freedom of assembly and opinion. • But also in Hungary and Italy the civil rights of ethnic minorities are inadequately protected. • Among the lower ranking countries, there is a real deficit in the rule of law (e.g. Mexico and Greece). • Preventing and fighting corruption – especially within the legal system – is among the central challenges for all countries in the lower ranking group. comparative politics
Policy Performance - findings • The largest financial and economic crisis seen in the post-war period left none of the surveyed countries unscathed. • Following the banking crisis policy has been shaped more by short-term crisis management than by structural reforms. • In addition to large economic stimulus programs and the stabilization of the banking sector, the political response included state intervention in the economy. • Countries that set the right priorities and decisively implemented necessary reforms have been able to stabilize trust in politics and the economy. • Policymakers must not lose sight of the long-term horizon. comparative politics
Economy and Employment - findings • Ireland and Iceland were especially hard hit by the economic and financial crisis. • On employment indicators the picture is mixed: Canada, Australia and the Netherlands still have relatively low unemployment rates despite the crisis. • Iceland, Ireland, Great Britain and the USA have enjoyed above-average labour market performance but have seen a spike in unemployment during the crisis. comparative politics
Economy and Employment – findings (cont’d) • Germany is a special case, since its previously high unemployment numbers fell continuously even during the crisis. • In most countries, unemployment remains at a relatively high level, with Turkey experiencing the most severe unemployment among the 31 OECD nations comparative politics
Social Affairs - findings • Again the Northern European countries take the lead in social inclusion and child care facilities. • However they are characterized by above-average tax burdens. • So far the Scandanavian countries have managed to defend their prosperity despite their extensive welfare states and high taxes. comparative politics
Internal and External Security - findings • Again the Scandanavian countries score well here with the exception of Denmark...... • On security policy the USA score is low due to its above average crime rate and military involvement in Iraq & Afghanistan • Mexico also has some internal security problems due to a high crime rate and unreliable police forces comparative politics
Resources - findings • Overall Finland, Sweden, Switzerland, Denmark, Germany and Japan lead this category. • In particular Germany and Great Britain have established themselves as pioneers in new environmental instruments. • In terms of environmental sustainability the USA is at the bottom of the rankings, although it leads the OECD nations in research and development. comparative politics
Research & Innovation comparative politics
Status Index – learning from the best • Significant strengths and weaknesses of OECD countries. • Countries with strong quality of democracy score better than the rest of the OECD countries on most areas of policy. • Close relationship between the two dimensions can be observed: the better the quality of a country’s democratic structures, the more likely it is to achieve sustainable reform policies. • Focus on similar policy areas in recent years: • Pension reform towards strengthening private pensions and increasing working life; • Improving compatibility of family and career. • Still need improvement in: • Research and development; • Sustainability in environmental and education policy; • Integration policy; • Fiscal policy. comparative politics
Agenda • Introduction • Approach and Methodology • SGI Ranking 2011 • Status Index • Management Index • Social Justice Index • Conclusions comparative politics
Executive Capacity and Executive Accountability - approach • Executive Capacity looks at strategic planning, consultation and communication as well as capacity for implementation and learning. • Executive Accountability looks at the capacity of citizens, legislatures, special interest groups and media participation in the political process. comparative politics
Executive Capacity vs. Executive Accountability comparative politics
Executive Capacity and Executive Accountability - findings • Again the Management indicators are lead by Norway and Sweden.....followed by Demark, Finland, New Zealand and Australia. • Again no particular system type is favoured. • Bringing up the rear are Greece and Slovakia. Both countries trail Italy (in 29th position) by almost a point. • New member Chile stands out positively, already scoring higher than some established OECD countries. comparative politics
Executive Capacity and Executive Accountability - findings (cont’d) • A closer look at both Executive Capacity and Executive Accountability is necessary in order to understand what’s really going on in a country....... • Certain countries obtain almost identical scores on the two dimensions (Australia, Ireland, Japan) • But others show wide discrepancies between the two.....(Canada, France, Mexico stand out here) comparative politics
Steering Capability comparative politics
Management Index - learning from the best • Quality of political steering varies widely among OECD nations. • There are pronounced differences between strategic steering capability as well as the capacity to include the knowledge and demands of citizens. • Top ranking countries show some similarities in the style of governing: • Countries that review their structures and processes and adjust them are better at strategic action and implementation of reform; • Countries that do not seek to improve by changing their institutions score low. comparative politics
Agenda • Introduction • Approach and Methodology • SGI Ranking 2011 • Status Index • Management Index • Social Justice Index • Conclusions comparative politics
Social Justice in the OECD comparative politics
Social Justice Index - findings • Northern Europe again leads the way. • Despite it’s overall high average Sweden is facing high youth unemployment, which is 3 times the average unemployment rate. • Most central, north-western, and east-central European countries are in the mid-range. • Poland lags behind the others due to pronounced deficits in access to the labour market. • Southern European countries all rank significantly below the OECD average. comparative politics
Agenda • Introduction • Approach and Methodology • SGI Ranking 2011 • Status Index • Management Index • Social Justice Index • Conclusions comparative politics
Conclusion • The SGI is the most thorough cross-national survey of governance in the OECD. • The project identifies reform needs and highlights forward-looking practices. • It tries to encourage debate on “good governance”.....and to help us “learn from the world”. comparative politics
Thank you Any questions? comparative politics