Download
1 / 15
150 likes | 314 Views
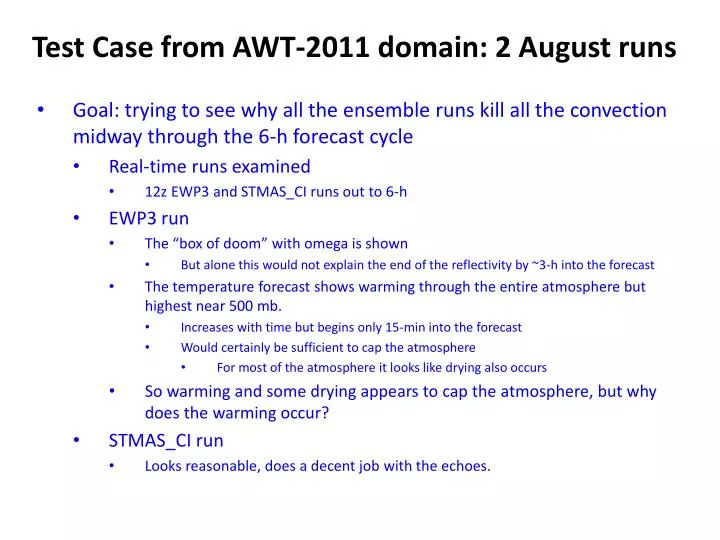
Test Case from AWT - 2011 domain: 2 A ugust runs. Goal: trying to see why all the ensemble runs kill all the convection midway through the 6-h forecast cycle Real-time runs examined 12z EWP3 and STMAS_CI runs out to 6-h EWP3 run The “box of doom” with omega is shown

E N D
Test Case from AWT-2011 domain: 2 August runs Goal: trying to see why all the ensemble runs kill all the convection midway through the 6-h forecast cycle Real-time runs examined 12z EWP3 and STMAS_CI runs out to 6-h EWP3 run The “box of doom” with omega is shown But alone this would not explain the end of the reflectivity by ~3-h into the forecast The temperature forecast shows warming through the entire atmosphere but highestnear 500 mb. Increases with time but begins only 15-min into the forecast Would certainly be sufficient to cap the atmosphere For most of the atmosphere it looks like drying also occurs So warming and some drying appears to cap the atmosphere, but why does the warming occur? STMAS_CI run Looks reasonable, does a decent job with the echoes.
Comparison of 500 mb temperatures at 12z on 2 August 2011 RUC analysis of 500 mb temperatures EWP3 analysis STMAS_CI analysis STMAS_CI_CYC analysis The analyses of 500 mb temperature are similar and compare well to the RUC analysis and observations.
Comparison of 500 mb temperatures at 16z on 2 August 2011 RUC analysis of 500 mb temperatures EWP3 4-h forecast STMAS_CI 4-h forecast STMAS_CI_CYC 4-h forecast The 4-h forecasts of 500 mb temperature from the STMAS runs are similar and compare well to the RUC analysis, while EWP3 is way too warm.
Closer look at the EWP3 500 mb temperature forecasts from the 12z on 2 August run EWP3 analysis of 500 mb temperatures EWP3 1-h forecast EWP3 2-h forecast EWP3 4-h forecast The erroneous 500 mb temperature warming in the EWP3 run gradually moves across the domain.
EWP3 wind omega forecasts from the 12z on 2 August run EWP3 analysis of omega EWP3 1-h forecast EWP3 2-h forecast EWP3 4-h forecast The erroneous 500 mb omega in the EWP3 run appears to move in from the boundaries and emanate from convection over WI.
Closer look the omega forecasts- Cross-section location is shown below
The erroneous omega seems to grow fairly gradually. EWP3 wind omega forecasts from the 12z on 2 August run – 15 min interval output for first hour EWP3 analysis of omega EWP3 15-min forecast EWP3 30-min forecast EWP3 45-min forecast
There is a dramatic increase in vertical velocity (sinking largely in this cross-section) between hours 1 and 2, then the scale seems to break down into smaller horizontal scales but still large values (more waves if you will, sort of get this same interpretation from the horizontal omega plots at 500 mb shown earlier). EWP3 wind omega forecasts from the 12z on 2 August run – 1-h interval output for hours 1 to 4 EWP3 1-h forecast EWP3 2-h forecast EWP3 3-h forecast EWP3 4-h forecast
The vertical velocity from the STMAS_CI run looks reasonable. STMAS wind omega forecasts from the 12z on 2 August run – 1-h interval output for hours 0 to 3 Analysis 1-h forecast 2-h forecast 3-h forecast
There is a tendency perhaps for the erroneous vertical velocities in EWP3 to weaken by 6-h. The STMAS_CI run looks reasonable and is shown to compare to the EWP3 run. EWP3/STMAS_CI wind omega forecast comparison for hours 4 and 6 from the 12z forecast run STMAS_CI4-h forecast STMAS_CI 6-h forecast EWP3 4-h forecast EWP3 6-h forecast
analysis The two runs are compared. The white arrows point to the STMAS_CI run (fatter arrow with wider head points to the temperature, the other white arrow to the dew point curve (dotted line, harder to see). The yellow arrows do the same for the EWP3 run. The soundings are very close at the analysis time. By 1-h into the forecast the EWP3 run is considerably warmer, with the greatest warming at 500 mb, but really spread through pretty much the entire atmosphere. Note how the spread in temperature between the two runs grows with time. It appears that the EWP3 run (white arrows) is consistently more moist (at least at this point (grid point 25/25). 1-h forecast EWP3/STMAS_CI sounding comparison for hours 0 to 6 from the 12z forecast run 4-h forecast 6-h forecast
analysis 15-min forecast In this sequence we look at the sounding at point 25/25 from the EWP3 run only, at 15-min intervals for the first hour. The fatter yellow arrow points to the temperature profile and the thinner yellow arrow points to the dewpoint curve. The off-white vertical arrow is held at the 400 mb temperature from the analysis for reference. Using this point as a reference shows the gradual warming that begins at 15-min into the run. EWP3 sounding comparison for the first hour from the 12z forecast run 30-mon forecast 45-min forecast
EWP3/STMAS_CI cross-section temperature forecast comparison from the 12z forecast run EWP3 analysis EWP3 4-h forecast EWP3 6-h forecast Here is another look at the temperature forecasts using the same cross-section as earlier. For reference the horizontal white line is at 500 mb, and the yellow line at 700 mb in each figure. You can see that the temperature at these two levels does not change much at all in the STMAS_CI run, but warms in the EWP3 run. The initial temperatures (analysis) are close but not identical, particularly in the lowest 100-200 mbor so. STMAS_CI 6-h forecast STMAS_CI analysis
Analysis 1-h forecast 2-h forecast EWP3 STMAS_CI NOWRAD 1400 UTC 1200 UTC 1300 UTC The warming shown in the previous slides would explain why the echoes disappear in EWP3, eventually the domain is severely capped. STMAS looks good.
3-h forecast 4-h forecast 6-h forecast EWP3 STMAS_CI NOWRAD 1800 UTC 1500 UTC 1600 UTC The echoes are pretty much gone by 3-h into the EWP3 forecast. General forecast from STMAS_CI looks good, misses the New England cells.