Download
1 / 29
290 likes | 496 Views
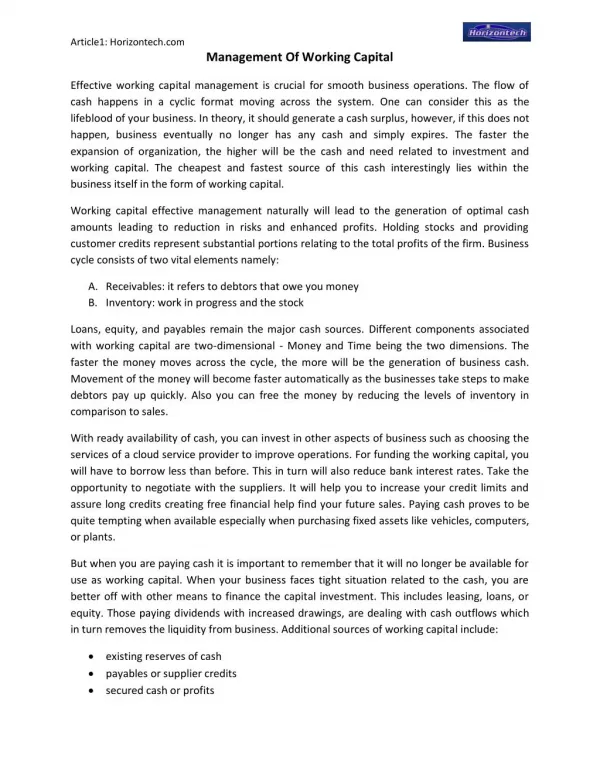
Overview of Working Capital Management. Concepts of Working Capital. Gross working capital (GWC) GWC refers to the firm’s total investment in current assets.

E N D
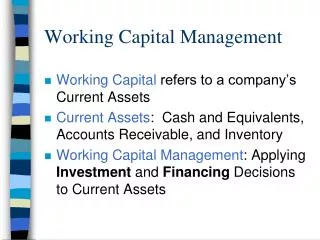
Concepts of Working Capital • Gross working capital (GWC) GWC refers to the firm’s total investment in current assets. Current assets are the assets which can be converted into cash within an accounting year (or operating cycle) and include cash, short-term securities, debtors, (accounts receivable or book debts) bills receivable and stock (inventory).
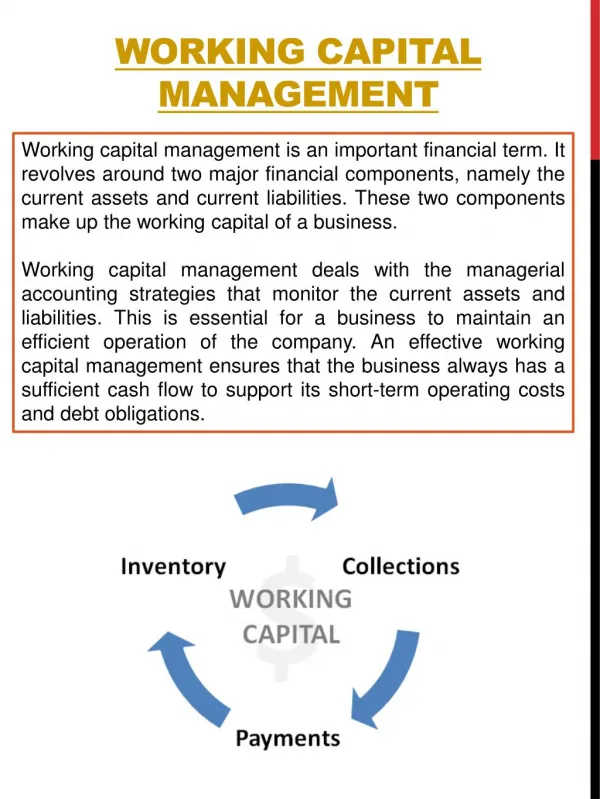
Concepts of Working Capital • Net working capital (NWC). • NWC refers to the difference between current assets and current liabilities. • Current liabilities(CL) are those claims of outsiders which are expected to mature for payment within an accounting year and include creditors (accounts payable), bills payable, and outstanding expenses. • NWC can be positive or negative. • Positive NWC= CA > CL • Negative NWC = CA < CL
Working Capital Concepts Net Working Capital Current Assets - Current Liabilities. Gross Working Capital The firm’s investment in current assets. Working Capital Management The administration of the firm’s current assets and the financing needed to support current assets.
Significance of Working Capital Management • In a typical manufacturing firm, current assets exceed one-half of total assets. • Excessive levels can result in a substandard Return on Investment (ROI). • Current liabilities are the principal source of external financing for small firms. • Requires continuous, day-to-day managerial supervision. • Working capital management affects the company’s risk, return, and share price.
Assumptions 50,000 maximum units of production Continuous production Three different policies for current asset levels are possible Optimal Amount (Level) of Current Assets Working Capital Issues Policy A Policy B Policy C ASSET LEVEL ($) Current Assets 0 25,000 50,000 OUTPUT (units)
Liquidity Analysis PolicyLiquidity A High B Average C Low Greater current asset levels generate more liquidity; all other factors held constant. Optimal Amount (Level) of Current Assets Impact on Liquidity Policy A Policy B Policy C ASSET LEVEL ($) Current Assets 0 25,000 50,000 OUTPUT (units)
Return on Investment = Net Profit Total Assets Let Current Assets = (Cash + Rec. + Inv.) Return on Investment = Net Profit Current + Fixed Assets Optimal Amount (Level) of Current Assets Impact on Expected Profitability Policy A Policy B Policy C ASSET LEVEL ($) Current Assets 0 25,000 50,000 OUTPUT (units)
Profitability Analysis PolicyProfitability A Low B Average C High As current asset levels decline, total assets will decline and the ROI will rise. Optimal Amount (Level) of Current Assets Impact on Expected Profitability Policy A Policy B Policy C ASSET LEVEL ($) Current Assets 0 25,000 50,000 OUTPUT (units)
Decreasing cash reduces the firm’s ability to meet its financial obligations. More risk! Stricter credit policies reduce receivables and possibly lose sales and customers. More risk! Lower inventory levels increase stockouts and lost sales. More risk! Optimal Amount (Level) of Current Assets Impact on Risk Policy A Policy B Policy C ASSET LEVEL ($) Current Assets 0 25,000 50,000 OUTPUT (units)
Risk Analysis PolicyRisk A Low B Average C High Risk increases as the level of current assets are reduced. Optimal Amount (Level) of Current Assets Impact on Risk Policy A Policy B Policy C ASSET LEVEL ($) Current Assets 0 25,000 50,000 OUTPUT (units)
SUMMARY OF OPTIMAL CURRENT ASSET ANALYSIS Policy LiquidityProfitabilityRisk A High Low Low B Average Average Average C Low High High 1. Profitability varies inversely with liquidity. 2. Profitability moves together with risk. (risk and return go hand in hand!) Summary of the Optimal Amount of Current Assets
Operating Cycle • Operating cycle is the time duration required to convert sales, after the conversion of resources into inventories, into cash. The operating cycle of a manufacturing company involves three phases: • Acquisition of resourcessuch as raw material, labour, power and fuel etc. • Manufacture of the product which includes conversion of raw material into work-in-progress into finished goods. • Sale of the producteither for cash or on credit. Credit sales create account receivable for collection.
Length of Operating Cycle • The length of the operating cycle of a manufacturing firm is the sum of: • inventory conversion period (ICP). • Debtors(receivable) conversion period (DCP).
Operating Cycle • Inventory conversion period is the total time needed for producing and selling the product. Typically, it includes: • raw material conversion period (RMCP) • work-in-process conversion period (WIPCP) • finished goods conversion period (FGCP) • The debtors conversion period is the time required to collect the outstanding amount from the customers. • Creditors orpayablesdeferralperiod (CDP) is the length of time the firm is able to defer payments on various resource purchases.
Operating Cycle • Gross operating cycle (GOC) The total of inventory conversion period and debtors conversion period is referred to as gross operating cycle (GOC). • Net operating cycle (NOC) NOC is the difference between GOC and CDP. • Cash conversion cycle (CCC) CCC is the difference between NOP and non-cash items like depreciation.
Classifications of Working Capital • Components • Cash, marketable securities, receivables, and inventory • Time • Permanent • Temporary
Permanent Working Capital The amount of current assets required to meet a firm’s long-term minimum needs. DOLLAR AMOUNT Permanent current assets TIME
Temporary Working Capital The amount of current assets that varies with seasonal requirements. Temporary current assets DOLLAR AMOUNT Permanent current assets TIME
Financing Current Assets: Short-Term and Long-Term Mix Spontaneous Financing: Trade credit, and other payables and accruals, that arise spontaneously in the firm’s day-to-day operations. • Based on policies regarding payment for purchases, labor, taxes, and other expenses. • We are concerned with managing non-spontaneous financing of assets.
Hedging (or Maturity Matching) Approach A method of financing where each asset would be offset with a financing instrument of the same approximate maturity. Short-term financing** Current assets* DOLLAR AMOUNT Long-term financing Fixed assets TIME
Hedging (or Maturity Matching) Approach * Less amount financed spontaneously by payables and accruals. **In addition to spontaneous financing (payables and accruals). Short-term financing** Current assets* DOLLAR AMOUNT Long-term financing Fixed assets TIME
Financing Needs and the Hedging Approach • Fixed assets and the non-seasonal portion of current assets are financed with long-term debt and equity (long-term profitability of assets to cover the long-term financing costs of the firm). • Seasonal needs are financed with short-term loans (under normal operations sufficient cash flow is expected to cover the short-term financing cost).
Risks vs. Costs Trade-Off (Conservative Approach) Firm can reduce risks associated with short-term borrowing by using a larger proportion of long-term financing. Short-term financing Current assets DOLLAR AMOUNT Long-term financing Fixed assets TIME
Risks vs. Costs Trade-Off (Conservative Approach) • Long-Term Financing Benefits • Less worry in refinancing short-term obligations • Less uncertainty regarding future interest costs • Long-Term Financing Risks • Borrowing morethan what is necessary • Borrowing at a higher overall cost (usually) • Result • Manager accepts less expected profits in exchange for taking less risk.
Risks vs. Costs Trade-Off (Aggressive Approach) Firm increases risks associated with short-term borrowing by using a larger proportion of short-term financing. Short-term financing Current assets DOLLAR AMOUNT Long-term financing Fixed assets TIME
Comparison with an Aggressive Approach • Short-Term Financing Benefits • Financing long-term needs with a lower interest cost than short-term debt • Borrowing only what is necessary • Short-Term Financing Risks • Refinancing short-term obligations in the future • Uncertain future interest costs • Result • Manager accepts greater expected profits in exchange for taking greater risk.
Summary of Short- vs. Long-Term Financing Financing Maturity SHORT-TERM LONG-TERM Asset Maturity SHORT-TERM (Temporary) Moderate Risk-Profitability Low Risk-Profitability High Risk-Profitability LONG-TERM (Permanent) Moderate Risk-Profitability
Determinants of Working Capital • Nature of business • Market and demand • Technology and manufacturing policy • Credit policy • Supplies’ credit • Operating efficiency • Inflation