Graph Comparison and Slope Interpretation Lab Activities
Explore the characteristics of buggy motion through graph comparisons, analyzing slopes, and interpreting y-intercepts. Learn how different graph slopes and y-intercepts indicate various motions and behaviors of the buggy on a whiteboard.

Graph Comparison and Slope Interpretation Lab Activities
E N D
Presentation Transcript
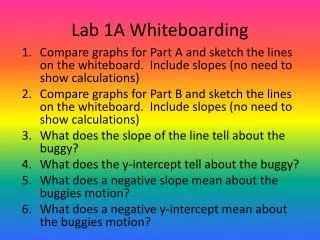
Lab 1A Whiteboarding • Compare graphs for Part A and sketch the lines on the whiteboard. Include slopes (no need to show calculations) • Compare graphs for Part B and sketch the lines on the whiteboard. Include slopes (no need to show calculations) • What does the slope of the line tell about the buggy? • What does the y-intercept tell about the buggy? • What does a negative slope mean about the buggies motion? • What does a negative y-intercept mean about the buggies motion?
Lab 1B Whiteboarding • Compare graphs for Part A and sketch the lines on the whiteboard. Include slopes (no need to show calculations) • Compare graphs for Part B and sketch the lines on the whiteboard. Include slopes (no need to show calculations) • What does the slope of the line tell about the buggy? • What does the y-intercept tell about the buggy? What should the y-intercept be for these experiments? • What does a negative slope mean about the buggies motion?
Lab 1C Whiteboarding • Compare graphs for Part A and sketch the lines on the whiteboard. Include slopes (no need to show calculations) • Compare graphs for Part B and sketch the lines on the whiteboard. Include slopes (no need to show calculations) • What should the y-intercept be for these experiments? Why? • What does the slope of the line in a time vs. distance graph tell about the motion of an object? • What does the slope of the line in a distance vs. time graph tell about the motion of an object?
Lab 1 Whiteboarding • Sketch the following graphs: • Speeding up forwards • Stopped • Slowing down backwards • Constant speed forwards • Speeding up backwards • Slowing down forwards • Constant speed backwards • For a distance vs. time graph: • What does the y-intercept tell about the motion? • What does a negative y-intercept mean about the motion? • The steeper the slope . . . • Sketch this graph and describe the motion: d t