Download

1 / 62
620 likes | 802 Views
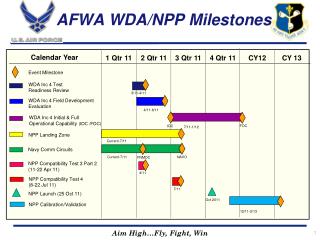
Advanced Objective Dvorak Technique (AODT) AFWA/XOGM. Material for this training module largely comes from:. UW-CIMSS Advanced Objective Dvorak Technique (AODT). Tim Olander and Chris Velden University of Wisconsin - Madison Cooperative Institute for Meteorological Satellite Studies

E N D
Material for this training module largely comes from: UW-CIMSS Advanced Objective Dvorak Technique (AODT) Tim Olander and Chris Velden University of Wisconsin - Madison Cooperative Institute for Meteorological Satellite Studies In cooperation with : Jeff Hawkins Naval Research Laboratory - Monterey, CA Office of Naval Research
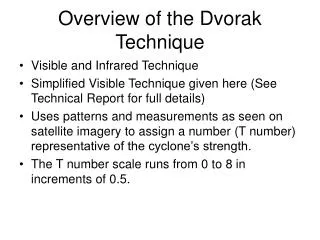
Advanced Objective Dvorak Technique (AODT) Overview - What is the AODT?- How does it work?- Why use it?- How will we use it here?
Advanced Objective Dvorak Technique (AODT) What is the AODT?AODT is a computerized method for determining the intensity of tropical cyclones. It was originally developed by the University of Wisconsin, and we are able to perform some AODT functions currently.Ok, so how does it work?
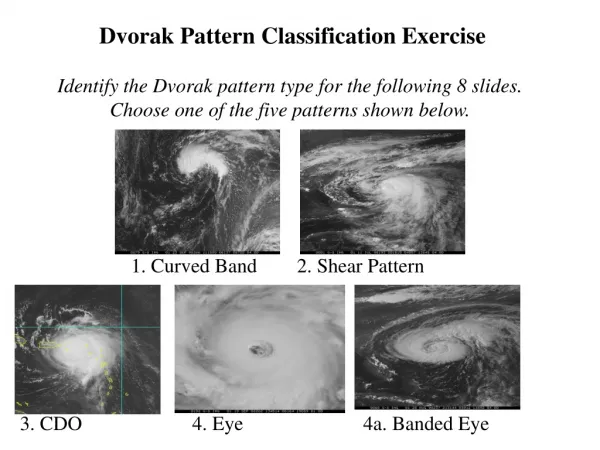
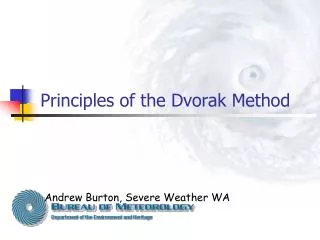
Identification of two environmental temperatures (BTs) Uses IR data only Eye Temperature (0-40 km) Cloud Temperature (26-136 km) Scene identification performed AODT is only performed for five types of features: Eye, Embedded Center, CDO, Curved Band, and Shear SIDAS version handles all five features Based on histogram and Fourier Transform Analysis AODT Methodology
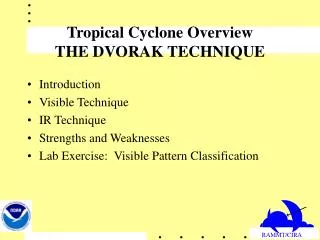
Determination of the cloud pattern is performed objectively (in other words, by the computer) by examining area histograms of cloud top temperatures and corresponding Fourier Analysis for the eye region and surrounding cloud region. Based on this analysis, five scene patterns can be categorized by AODT: Eye, Central Dense Overcast, Embedded Center, Curved Band, and Shear. AODT Methodology
Storm Center Location The only user input is the specification of the storm center location AODT depends on a fixer’s position to work AODT only does intensities EYE determination If the storm has an eye, it uses the warmest pixel temperature within a 40 km radius of the chosen storm center Warm values represent ocean surface or low cloud within the eye This value is retained as the 'eye temperature'. AODT Methodology
EYE determination (con’t) AODT analyzes temperatures on concentric rings (1 pixel wide) centered on the eye between 24 km and 136 km from the eye location (this range was empirically determined by many observations of coldest ring radii). For GOES data with 4km pixel resolution, this results in a total of 28 rings that are analyzed to determine the 'surrounding temperature'. In addition, a continuous ring of cold temperatures surrounding the eye is more indicative of an organized (and more intense) storm than one with breaks in the convection. Therefore, the warmest temperature found on each ring is identified and stored, with the coldest of these retained as the final surrounding temp value. AODT does not reposition the storm center, since it has been found that the subsequent analysis of the surrounding temperature field may be improperly influenced by this adjustment in some cases ('false' eyes). AODT Methodology
AODT Methodology The warmest temperature is found on each ring...
AODT Methodology This ring has “Light Grey” as its warmest temp.
AODT Methodology Of those temps that are left, the coldest is taken as the surrounding ring
“No Eye” Condition AODT can handle Central Dense Overcast (CDO)/Embedded Center Temperatures near the storm center are dominated by cold cloud tops and a warm eye is not resolvable. The value of the pixel at the user-defined storm center location is used as the 'eye’ temperature Shear scenario is also detected in AODT The CURVED BAND, SHEAR, CDO/EMBD CTR ARE AVAILABLE IN SIDAS II, but not the older SIDAS I. AODT Methodology
Initial intensity estimate determined (Raw T#) Based on original Dvorak Rules for different patterns and cloud top temperatures. Eye temperature serves as adjustment Use history file with previous storm analysis data (Final T#) Provide data for 12-hour time weighted time averaging scheme This means we have to perform AODT after every fix Data is saved in SIDAS interface Implementation of Dvorak Rule 9 for weakening storms (CI#) Corrects underestimate bias in weakening storms Hold T# constant for 12 hours after initial weakening, add 1.0 T# until dissipation or restrengthening Not currently implemented in SIDAS AODT Methodology
AODT Purpose • Ok, but why use it? • 1. It’s OBJECTIVE • Doesn’t depend on opinions of human being • Done the same way every time • Can be more accurate (sometimes) • 2. It’s FAST • Computer derived • Some storms are harder than others • 3. It’s WANTED • JTWC has formally requested that we do this • Test mode only for now
Operational Use NOAA/NESDIS Satellite Analysis Branch NHC/Tropical Analysis Forecast Branch Joint Typhoon Warning Center Experimental Use Air Force Weather Agency Central Pacific Hurricane Center Australian Bureau of Meteorology Japanese Meteorological Agency Current User Status
AODT Implementation • JTWC uses it on NSDS-E • SAB uses it in MCIDAS • How will we use it here? • SIDAS II • New AODT option in the interaction menu AODT IS ALWAYS TO BE PERFORMED AFTER YOU COMPLETE YOUR OWN INDEPENDENT ANALYSIS!
To Begin an AODT calculation, first you must estimate the position of the low level circulation center (LLCC) manually.
Use the “Lat/Lon Browse” feature in SIDAS II to determine the lat/long of the LLCC.
You can interactively roam on the satellite graphic to determine the lat/long of the LLCC.
Next, go to the “Interaction Mode” pull-down menu and select [AODT]. Next, hit the LLCC position on the satellite graphic – once!
The AODT graphical user interface (GUI) will now say ‘Calculating AODT’ inside the GUI textbox. This might take 30-60 seconds. Please wait.
The AODT GUI displays a spot analysis calculation. This calculation has not been initialized, so it is quite possible that this might be a very wildly inaccurate number. Please do not worry about this first number when you are starting a storm for the first time.
We are going to properly initialize AODT now.Go to the “IC value” pull-down menu and select the T number that you chose in your manual Dvorak classification. ONLY DO THIS FOR THE INITIAL AODT calculation for any storm.
Notice that this storm is started as a T1.5. I could have chosen T1.0, depending on the intial intensity of the storm.
Also, notice that I could have chosen a higher T number – this can be done if you forgot to start AODT normally, but the results will be less accurate if you do this…... So start on time!
The text window of the AODT GUI now says “Recalculate AODT”. Just hit the [OK] button here!
The AODT graphical user interface (GUI) will now say ‘Calculating AODT’ inside the GUI textbox. This might take 30-60 seconds. Please wait.
The AODT GUI displays a a properly initialized analysis calculation. Since This calculation is your very first one, it will almost always be identical to the “IC value” that you selected earlier. This is not a problem.
1. Hit the button [Start new file]. You will see a windows file directory interface appear, as seen here here in the upper left hand corner. Navigate to L:\tropical\AODT\2004 2. Note: “L: drive” is mounted to nt18, under the “z_drive partition”. See Mr. McCrone for set up help
1. In the windows file directory interface, navigate to the ocean basin that the storm is in (SIO, NWPAC, ATL, etc). Enter a file name that describes the storm. An example would be: TC-14S-monty. The file system will put the “.odt” extension on the end of the file.
You have now correctly started a storm. JUST HIT [OK] here. You may now return to normal SIDAS ops.
* Normally, you will be doing another manual position fix in 3 hours. At this point, you will load the new image into SIDAS II, then get your fix position, similar to the process described earlier. Then you hit [AODT] again… & select the LLCC from your fix (only hit it once!)
The AODT GUI comes up again. Hit the button called [Select AODT history file]. A windows file select interface will appear.
The AODT GUI comes up again. Hit the button called [Select AODT history file]. A windows file select interface will appear.
A windows file select interface will appear. Select the file that is connected with the storm that you are analyzing.
The text window of the AODT GUI now says “Recalculate AODT”. Just hit the [OK] button here!
The AODT graphical user interface (GUI) will now say ‘Calculating AODT’ inside the GUI textbox. This might take 30-60 seconds. Please wait.
The AODT GUI displays a a time averaged analysis calculation. This calculation may be a number like T1.8, or 4.7, etc.
There are two pieces of info to record on your fix bulletin: The CI # and the Scene type.
You need to save this data! To save, you hit the [Write History] button once!