Download
1 / 50
500 likes | 684 Views
Chapter 6 The Human Population and Its Impact.

E N D
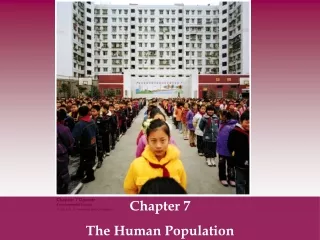
Chapter 6 The Human Population and Its Impact
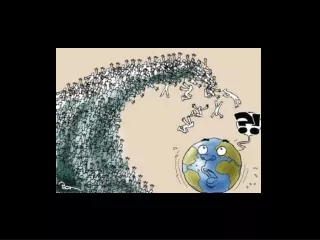
The problems to be faced are vast and complex, but come down to this: 6.9 billion people are breeding exponentially. The process of fulfilling their wants and needs is stripping earth of its biotic capacity to support life; a climatic burst of consumption by a single species is overwhelming the skies, earth, waters, and fauna. - Paul Hawken
6-1 How Many People Can the Earth Support? • Concept 6-1 We do not know how long we can continue increasing the earth’s carrying capacity for humans without seriously degrading the life-support system that keeps us and many other species alive.
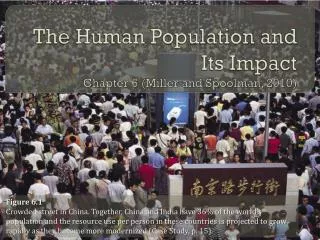
Core Case Study: Slowing Population Growth in China: A Success Story • 1.3 billion people • Promotes one-child families • Contraception, abortion, sterilization • Benefits to families who abide • Fast-growing economy • Serious resource and environmental problems
Human Population Growth Continues but It Is Unevenly Distributed • Reasons for human population increase • Movement into new habitats and climate zones • Early and modern agriculture methods • Control of infectious diseases through • Sanitation systems • Antibiotics • Vaccines • Health care • Most population growth over last 100 years due to drop in death rates
Human Population Growth Continues but It Is Unevenly Distributed • Population growth in developing countries is increasing 9 times faster than developed countries • 2050 • 95% of growth in developing countries • 7.8-10.8 billion people • Should the optimum sustainable population be based on cultural carrying capacity? -the maximum # of people who could live in reasonable comfort and freedom indefinitely with decreasing sustainability of earth for future generations
Human Population Growth Fig. 1-18, p. 21
Population Time Line: 10,000 BC - 2042 Figure 3, Supplement 9
Annual Growth Rate of World Population, 1950-2010 POPULATION: http://www.census.gov/main/www/popclock.html Fig. 6-2, p. 127
Where Population Growth Occurred, 1950-2010 Fig. 6-3, p. 127
Five Most Populous Countries, 2010 and 2050 Fig. 6-4, p. 127
Science Focus: Projecting Population Change • Why range of 7.8-10.8 billion for 2050? • Demographers must: • Determine reliability of current estimates • Make assumptions about fertility trends • Deal with different databases and sets of assumptions
World Population Projections to 2050 Fig. 6-A, p. 128
Science Focus: How Long Can The Human Population Keep Growing? • Thomas Malthus and population growth: 1798 • Overpopulation and overconsumption • Will technology increase human carrying capacity? • Can the human population grow indefinitely?
Natural Capital Degradation: Altering Nature to Meet Our Needs Fig. 6-B, p. 129
6-2 What Factors Influence the Size of the Human Population? • Concept 6-2A Population size increases because of births and immigration, and decreases through deaths and emigration. • Concept 6-2B The average number of children born to women in a population (total fertility rate) is the key factor that determines population size.
The Human Population Can Grow, Decline, or Remain Fairly Stable • Population change • Births: fertility • Deaths: mortality • Migration • Population change = (births + immigration) – (deaths + emigration) • Crude birth rate: # live births/1000/year • Crude death rate: # deaths/1000/year
Women Having Fewer Babies but Not Few Enough to Stabilize the World’s Population • Fertility rate • number of children born to a woman during her lifetime • Replacement-level fertility rate • Average number of children a couple must have to replace themselves • 2.1 in developed countries • Up to 2.5 in developing countries • Total fertility rate (TFR) • Average number of children born to women in a population
Total fertility rate, 1955-2010 Fig. 6-5, p. 130
2010 Rate of Population Increase Figure 11, Supplement 8
Total Fertility Rate Figure 12, Supplement 8
U.S. TFRs and birth rates 1917-2010 Fig. 6-6, p. 131
20th Century Lifestyle Changes in the U.S. Fig. 6-7, p. 132
Several Factors Affect Birth Rates and Fertility Rates • Children as part of the labor force • Cost of raising and educating children • Availability of private and public pension • Urbanization • Educational and employment opportunities for women
Several Factors Affect Birth Rates and Fertility Rates • Average age of a woman at birth of first child • Availability of legal abortions • Availability of reliable birth control methods • Religious beliefs, traditions, and cultural norms
Several Factors Affect Death Rates • Life expectancy • Infant mortality rate • Number of live births that die in first year • Why are people living longer? • Increased food supply and distribution • Better nutrition • Medical advances • Improved sanitation
Several Factors Affect Death Rates (2) • U.S. is 54th in world for infant mortality rate • U.S. infant mortality rate high due to • Inadequate health care for poor women during pregnancy and their infants • Drug addiction among pregnant women • High birth rate among teenagers
Infant Mortality Rates, 1950-2010 Fig. 6-10, p. 134
Infant Mortality Rates in 2010 Figure 13, Supplement 8
Migration Affects an Area’s Population Size • Economic improvement • Religious freedom • Political freedom • Wars • Environmental refugees
Legal Immigration to the U.S. between 1820 and 2006 Fig. 6-11, p. 135
6-3 How Does a Population’s Age Structure Affect Its Growth or Decline? • Concept 6-3 The numbers of males and females in young, middle, and older age groups determine how fast a population grows or declines.
A Population’s Age Structure Helps Us Make Projections • Age structure categories • Prereproductive ages (0-14) • Reproductive ages (15-44) • Postreproductive ages (45 and older) • Seniors are the fastest-growing age group
Generalized Population Age-Structure Diagrams Fig. 6-12, p. 136
Population Structure by Age and Sex in Developing and Developed Countries Fig. 6-13, p. 136
Tracking the Baby-Boom Generation in the United States Fig. 6-14, p. 137
Populations Made Up of Mostly Older People Can Decline Rapidly • Slow decline • Manageable • Rapid decline • Severe economic problems • How pay for services for elderly • Proportionally fewer young people working • Labor shortages • Severe social problems
Populations Can Decline from a Rising Death Rate: The AIDS Tragedy • 27 million killed: 1981-2009 • Many young adults die: loss of most productive workers • Sharp drop in life expectancy • International community • Reduce the spread of HIV through education and health care • Financial assistance and volunteers
Botswana Age Structure, With and Without AIDS Fig. 6-16, p. 139
6-4 How Can We Slow Human Population Growth? • Concept 6-4 We can slow human population growth by reducing poverty, elevating the status of women, and encouraging family planning.
As Countries Develop, Their Populations Tend to Grow More Slowly • Demographic transition • First death rates decline • Then birth rates decline • Four stages • Preindustrial • Transitional • Industrial • Postindustrial
Four Stages of the Demographic Transition Fig. 6-17, p. 140
TFR in Bangladesh and U.S., 1800-2010 Fig. 6-18, p. 140
Empowering Women Can Slow Population Growth • Factors that decrease total fertility rates: • Education • Paying jobs • Ability to control fertility • Women • Do most of the domestic work and child care • Provide unpaid health care • 2/3 of all work for 10% of world’s income • Discriminated against legally and culturally
Promote Family Planning • Family planning in less-developed countries • Responsible for a 55% drop in TFRs • Financial benefits: money spent on family planning saves far more in health, education costs • Two problems • 42% pregnancies unplanned, 26% end with abortion • Many couples do not have access to family planning
Case Study: Slowing Population Growth in India • 1.2 billion people, most populous country in 2015 • Problems • Poverty • Malnutrition • Environmental degradation • Bias toward having male children • Poor couples want many children • Only 48% of couples use family planning
Homeless Woman and Child in India Fig. 6-21, p. 143
Three Big Ideas • The human population is increasing rapidly and may soon bump up against environmental limits. • Even if population growth were not a serious problem, the increasing use of resources per person is expanding the overall human ecological footprint and putting a strain on the earth’s resources. • We can slow population growth by reducing poverty through economic development, elevating the status of women, and encouraging family planning.