Download
1 / 39
390 likes | 469 Views
Hurricane center-fixing with the Automated Rotational Center Hurricane Eye Retrieval (ARCHER) method. Tony Wimmers, Chris Velden. University of Wisconsin - Cooperative Institute for Meteorological Satellite Studies (CIMSS).

E N D
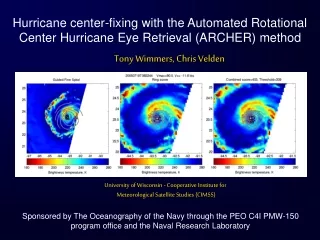
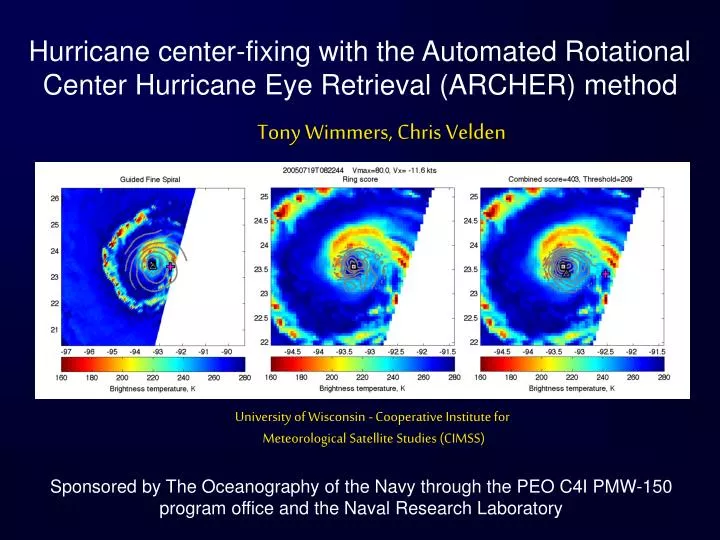
Hurricane center-fixing with the Automated Rotational Center Hurricane Eye Retrieval (ARCHER) method Tony Wimmers, Chris Velden University of Wisconsin - Cooperative Institute for Meteorological Satellite Studies (CIMSS) Sponsored by The Oceanography of the Navy through the PEO C4I PMW-150 program office and the Naval Research Laboratory
Motivation Forecasting (track) Input into automated retrievals (intensity, eye diameter, ERC…) Real time and reanalysis
“First guess” Center fix Objective Automated, robust location of TC rotational centers in individual microwave or IR images Must be resilient to false eyes (moats), obstructions in the eye, partial eyes, partial scan coverage Must rely only loosely on a first-guess (forecast) position estimate Must apply to microwave and IR imagery 85 GHz (H) TMI retrieval Additional information can be found in Wimmers, A. and C. Velden, 2010: Objectively Determining the Rotational Center of Tropical Cyclones in Passive Microwave Satellite Imagery, J. Appl. Meteor., 49, 2013–2034, 2010.
3) Combine the two 2D fields as a weighted sum into a single score field 2) Produce a separate 2D field that rates how well a location is centered inside a circular ring of convection “Combined Score” “Ring Score” “Spiral Score” ARCHER overview 1) Produce a 2D field (contoured) that expresses how well a location registers as the center of the large-scale spiral pattern
ARCHER: Additional procedures Images are pre-processed to compensate for a ~12 km parallax shift If the Combined Score at the center fix does not exceed a certain threshold value, then the algorithm defaults back to the first guess position
Example: Unresolved eye (Dennis 2005) 1) Wider domain
Example: Unresolved eye (Dennis 2005) 2) Zoomed view
Example: Unresolved eye (Dennis 2005) 3) With best track position
Example: Unresolved eye (Dennis 2005) 4) With simulated forecast position (first guess)
Example: Unresolved eye (Dennis 2005) 5) Spiral score
Example: Unresolved eye (Dennis 2005) 6) Ring score
Example: Unresolved eye (Dennis 2005) 7) Combined score
“First guess” Example: Unresolved eye (Dennis 2005) 8) Compare to best track position Center fix Best track
Example: Asymmetric eye (Chaba 2010) Oct 28 04:40 Z Vmax=115 kts 1. Strong, complete eyewall Center-fix
Example: Asymmetric eye (Chaba 2010) Oct 28 09:33 Z Vmax=112 kts 2. Shearing leads to asymmetric eyewall pattern Center-fix
Example: Asymmetric eye (Chaba 2010) Oct 28 10:52 Z Vmax=111 kts 3. Eyewall only evident on the western side Center-fix
Example: Asymmetric eye (Chaba 2010) Oct 28 22:02 Z Vmax=105 kts 4. Sub-pixel eye and banding only on the west Center-fix
Example: Asymmetric eye (Chaba 2010) Oct 29 07:56 Z Vmax=90 kts 5. Sub-pixel eye and a developing secondary eyewall Center-fix
Example: Asymmetric eye (Chaba 2010) Oct 29 20:38 Z Vmax=75kts 6. Completed eyewall replacement cycle Center-fix
Validation: 2005 season, North Atlantic Independent from calibration sample Uses the NHC best track as “truth” Only uses cases that are < 3 hours from an aircraft position fix
The algorithm performance will degrade in cases of high vertical shear, because of displacement between the centers of rotation at the surface and the image height, and also loss of symmetry • Because of this we separate the test sample into Group A (low/moderate shear) and Group B (high shear) • Group B is <10% of the sample • The ARCHER error for Group B averaged to be about double that of Group A Effect of vertical wind shear
0.15 0.06 Results: 85-92 GHz (H)
Center fix Tropical Storm example Best track (.25 away)
(Low organization) (Medium organization) (High organization) ARCHER: Adapting to IR imagery Organization score = 0.91 Organization score = 1.55 Organization score = 2.60 Calibrated and validated to a probability density function (PDF) Error, degrees Error, degrees Error, degrees
Graphical output: Spiral grid Combined grid ARCHER: Output for IR imagery Center-fix • Numerical output: • Forecast position (lon, lat): -61.10, 36.70 • Center-fix position (lon, lat): -60.81, 36.47 • Eye confidence (%) = 31 • Error distribution parameter (alpha) = 6.39 • Probability of error < 0.2° (%) = 36.5 • Probability of error < 0.4° (%) = 72.4 • Probability of error < 0.6° (%) = 90.0 • Probability of error < 1.0° (%) = 98.8 Often ~95% for more organized TCs
Final remarks Distribution A free, licensed version of ARCHER is available for distribution (Matlab code). HURSAT ARCHER does work with HURSAT and yields good results, although the imagery becomes twice-interpolated (once from HURSAT and then again by ARCHER), which means the result can often be improved by using original data. Ongoing work Current work involves a cross-comparison of ARCHER accuracy for microwave and IR imagery, and also finding the best way of combining microwave/IR results into a single storm track.
(Low organization) (Medium organization) (High organization) ARCHER: Adapting to IR imagery Organization score = 0.91 Organization score = 1.55 Organization score = 2.60 Calibrated and validated to a probability density function (PDF) Error, degrees Error, degrees Error, degrees
North Atlantic Forecast position error West Pacific
ARCHER: “Spiral Score” component • High values occur where the vector field lines up with the image gradients
ARCHER: “Spiral Score” component • High values occur where the vector field lines up with the image gradients
Summary ARCHER has several unique innovations: Balances the evidence from large-scale spiral edges with small-scale eyewall patterns Has an optimized default to the first guess as a backup option Validated with a large, independent sample of images The center-fix accuracy is ~16 km in all cases with low-to-moderate shear and ~6 km for non-default cases only. Current applications include TC visualization, TC diameter size retrieval, intensity estimation and prediction of rapid intensification.
Applications (1 of 4): MIMIC (MIMIC: Morphed Integrated Microwave Imagery at CIMSS) using multi-satellite 85-92 GHz retrievals. Finding the center of rotation of each image is critical to blending them together properly.
Applications (2 of 4): Microwave-based Intensity est. Eye and eyewall statistics in 85 GHz images add important TC intensity information to the MW-ADT at CIMSS in the 65-90 kt range, when eyes are often obscured by central dense overcast Diagnostic image for TC 26W (2009), leading to a MW-ADT estimate of Vmax = 73 kts. JTWC estimate was at 65 kts. [24 Nov 1052 UTC]
Applications (3 of 4): TC diameter information ARCHER RMW is significantly lower than the value produced by JT. A lower RMW would contribute to a better SATCON (Satellite Consensus) estimate for this TC, indicating that it is probably more accurate (see Herndon and Velden: SATCON Evaluation and Recent changes, Poster 33).
Applications (4 of 4): Rapid intensification Certain characteristics of the eyewall in 37 GHz imagery can indicate rapid intensification, but previously this has only been shown manually*. The ARCHER algorithm can automate this method by identifying the eye and eyewall This is described in the talk, Improvements in the Statistical Prediction of TC Rapid Intensification [Rozoff et al. Thursday am session] * Kieper (2008; 28th AMS Conf. on Hurr. and Trop. Meteor.)