Download
1 / 44
440 likes | 624 Views
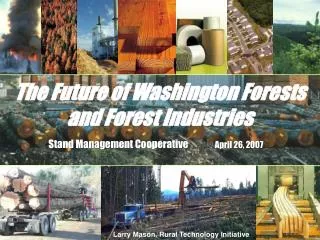
The Future of Washington Forests and Forest Industries. Stand Management Cooperative April 26, 2007. Larry Mason, Rural Technology Initiative. The Future of Washington’s Forests and Forest Industries Commissioned by the WA State Legislature 2005. Study Areas Include:

E N D
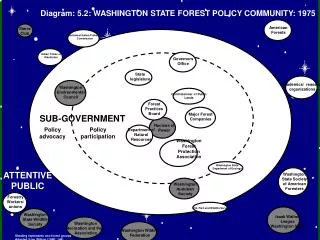
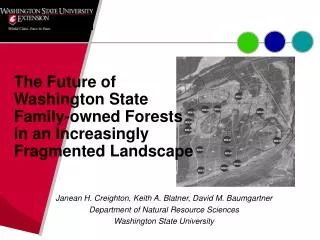
The Future of Washington Forests and Forest Industries Stand Management Cooperative April 26, 2007 Larry Mason, Rural Technology Initiative
The Future of Washington’s Forests and Forest Industries Commissioned by the WA State Legislature 2005 • Study Areas Include: • Timber Supply and Forest Structure Study 1 • Competitive Position Study 2 • Economic Contribution Study 3 • Land Conversion Study 4 • State Granted Return on Investment Study 5 PROGRESS REPORTS http://www.dnr.wa.gov/
? ? 4218 3,389 829 7029 3959 10988 Washington Unreserved Timberlands(thousands of acres) Less Roads, Buffers, Etc. 5800 3600 ~9400 Bolsinger, C. L., N. McKay, D. R. Gedney, and C. Alerich. 1997. Washington's Public and Private Forests. Resource Bulletin PNW-RB-218, USDA Forest Service, Pacific Northwest Research Station.*USDI Bureau of Indian Affairs. 2004. 2004 Status of Forest Management Inventories and Planning. USDI, Bureau of Indian Affairs, Division of Forestry, Branch of Forest Resource Planning.
North Puget Sound North Coast Central South Coast South Puget Sound Inland Empire South West Washington Timbersheds: Five Westside and Two Eastside
Westside Forest Types • Management Intensities • Harvest Implications • Land Conversions
Western Washington Harvest Volumes 1990 - 2002 Source: DNR Timber Harvest Report 2002
Historic Projected Sources: DNR Timber Harvest Report 2002, FIA age-class data, UW/WFPA Management intensities Survey, Chambers 1980 DNR RPT 41.
Historic Projected Source: Gray et al. 2005. PNW-RB-246
West Side Question: This or This?
Eastside Forest Types • Forest health & climate change • Fire/carbon/bioenergy • Mill Closures
Eastern Washington Harvest Volumes 1990 - 2002 Source: DNR Timber Harvest Report 2002
Historic Projected Sources: DNR Timber Harvest Reports 1965-2003, FIA & CVS Inventory Data; Tribal, Industry, Small Private Forestland Managers
Without treatment, dry fuels, drought, and hot summers mean catastrophic wildfire in eastern Washington
2006 Forest Fires Total WA ~ 400,000 acres Total US > 9.8 millionacres Source: NOAA, EPA, US Census, NIFC, RTI
East Side Question: This Or This
Source: TSS Consultants, http://www.cc.state.az.us/utility/electric/EPS-TSSC.pdf
WA Biomass and Bioenergy Potential by Feed Stock Type Source: WSU, WA DOE
Harvest 6,000 Loggers in Washington Annual Payroll = $250 million Employment = 1.84 loggers/MMBF/Yr
WCLA Survey Highlights – 98 Respondents ~ 900 MMBF/Yr • Average contract logger is over 50 years of age • 1995: 82% had health insurance but today: 53% • Skilled workers are much harder to find than 10 years ago • 13% make money; 48% break even; 40% lose money
Haul More than 1 million loads/year 150 million miles 2400 Truck Drivers Annual payroll = $100 million Employment = 0.65 Drivers/MMBF/Yr
70% of Truckers are independents • Average trucker is over 50 years of age • Skilled workers are much harder to find than 10 years ago Source: WCLA Survey, Timber purchasers survey, NW Truckers Coop, Log Truckers Conference
2006 - OR Trucks = 1593, WA Trucks = 1325 No. of WA Trucks down 36% since 1998 WA DOT, WA DOL, and ODOT
Sawn Wood Manufacture 12,000 mill workers in Washington Annual Payroll = $480 million Employment = 4.3 mill workers/MMBF/Yr
Average years in business = 60 Average No. Employees = 192 Average Production = 200MMBF/Yr Sales are 98% domestic Average worker age = 43 Skilled workers hard to find WA is #2 Producer in US 40% plan to expand 0% will pay for certified logs Sawmill Survey: 34 Respondents, 4.2 Billion BF Production
Reductions in log exports offset reductions in timber harvest for sawmills
Spotted Owl Closure of inefficient mills, improvements in technology, and shift to second growth result in overrun gains (west but not east). Source: DNR Mill Survey, RTI 2006 Survey
East Log Price $440 East Lumber Return Net Log (Not Good!) -$40 Eastside Over Run = 1.34 Coast Lumber Return Net Log (right side) Coast Log Price (left side) Year Lmbr Price Westside Over Run = 2.23 Source: Random Lengths, Log Lines, NW Management, Future of WA Forests
Pulp and Paper 8,500 Pulp and paper workers in Washington Annual Payroll = $450 million Employment = 2.5 paper workers/MMBF/Yr
No. of WA Pulp Mills & Pulp Export Facilities and Total Annual Production 1989 – 2002 45% Reduction in Domestic Production71% Reduction in Export Production
Forest Industry Summary 40,000 direct jobs & $1.7 billion in payroll 100,000 indirect jobs Gross Business Income (2005) = $14.6 billion