Download
1 / 48
490 likes | 782 Views
Evaluation of Five GIS based Interpolation Techniques for Estimating the Radon Concentration for Unmeasured Zip Codes in the State of Ohio. By Suman Maroju Department of Civil Engineering The University of Toledo Advisor: Ashok Kumar PhD. Introduction.

E N D
Evaluation of Five GIS based Interpolation Techniques for Estimating the Radon Concentration for Unmeasured Zip Codes in the State of Ohio By Suman Maroju Department of Civil Engineering The University of Toledo Advisor: Ashok Kumar PhD
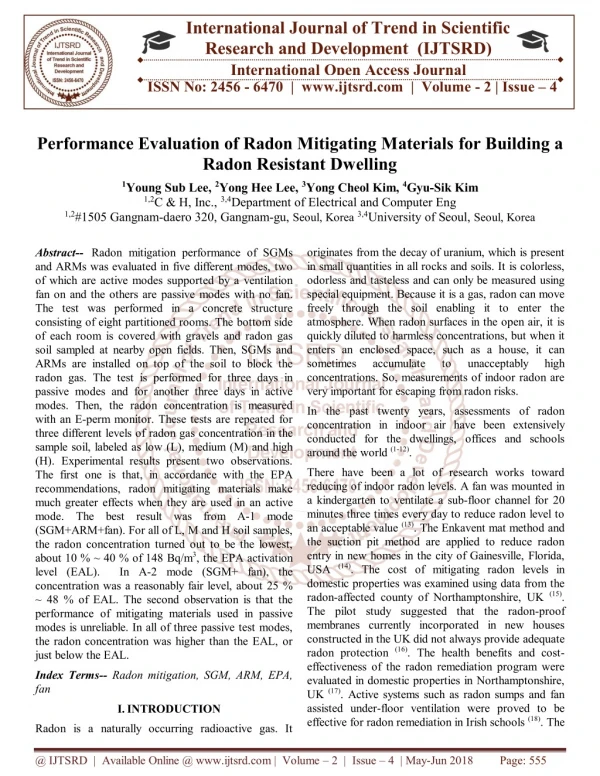
Introduction • Radon is a naturally occurring radioactive gas produced by the breakdown of Uranium in soil, rock and water. • Radon is the second most common cause of lung cancer after cigarette smoking, accounting for 15,000 to 22,000 cancer deaths per year in the US alone according to the National Cancer Institute (USA) • Radon gas is believed to cause about 14% of lung cancer deaths (1000+ deaths) in Ohio annually. • 45% of homes in Ohio exceed the USEPA action level. • 62.5% of schools in Ohio have at least one room in excess of the USEPA action level
Data Collection • Data collected from various county health departments, commercial testing services and university researchers. • Original database – Kumar et al. (1990) • 1996 and 1997 – 82,000 • New data being constantly added • Total of 130,826 observations used in this study
Objectives • To evaluate the best interpolation technique for the radon data set. • To perform this interpolation technique on the whole radon data set, obtain prediction map and estimate concentrations for unmeasured zip codes. • To present the impact of the results obtained from this study.
ArcGIS Geostatistical Analyst Geostatistical Analyst provides a wide variety of tools for spatial data exploration, identification of data anomalies, evaluation of error in prediction surface models, statistical estimation and optimal surface creation.
Exploratory Spatial Data Analysis (ESDA) Tool • The ESDA tools are designed to explore the distribution of data, look for global trends in the data, examining spatial autocorrelation and understand the correlation between multiple data sets. • Tools include Histogram, Normal QQ Plot, Trend Analysis, Semivariogram/Covariance Cloud.
Histogram • The Histogram tool in ESDA provides a univariate (one-variable) description of the data. • The plots shows the frequency distribution for the radon data set.
Normal QQ Plot • The QQ Plot is to compare the distribution of the data to a standard normal distribution.
East-West trend line North-South axis Trend Analysis North-South Trend line • The Trend Analysis tool can help identify global trends in the input data set. East-West axis
Semivariogram/Covariance Cloud Semivariogram points representing pairs of locations
Approach • The geometric mean of radon concentration values is inputted for each zip code and zero values are assigned to the zip codes that are not measured. • The polygon features of Ohio zip codes shape file is converted into point features to input as point data source in the interpolation techniques. • The point featured shape file is then divided into two shape files; one having 1066 zip codes with radon concentration data and the other contains 796 zip codes with no measured radon concentration data.
Approach • The first step is to evaluate the best interpolation technique. • The point featured shape file is divided into 80% training data points and 20% test data points. Sensitivity analysis for division of data set • Then the different interpolation techniques are executed using the training data points which creates a layer of spatial variation and the predictions are evaluated for test data points.
Approach • Second part • Best interpolation technique is chosen based on values of statistical parameters. • Modeling is done for the whole radon data set, which creates a surface of spatial variation and the predictions for unmeasured zip codes (where no data is collected) is evaluated from the surface created.
Interpolation methods • Five Interpolation Techniques • Ordinary Kriging • Inverse Distance Weighting (IDW) • Radial Basis Function (RBF) • Local Polynomial Interpolation • Global Polynomial Interpolation
Ordinary Kriging • Kriging is divided into two distinct tasks: • Quantifying the spatial structure of the data (known as variography) and producing a prediction i.e., fitting a spatial dependence model to the data. • Make a prediction for the unknown value of a specific location. Achieved by using the fitted model from the variography (spatial data configuration) and values of the measured sample points around the prediction location.
Ordinary Kriging The equation used in Ordinary Kriging is: • Z* (u) is the Ordinary Kriging estimate at spatial location u, • n (u) is the number of the data used at the known locations given a neighborhood • Z (uα) are the n measured data at locations uα located close to u • m= mean of distribution m Z*(u)=
Ordinary Kriging λα (u)= weights for location uα computed from the spatial covariance matrix based on the spatial continuity (variogram) model, which is given by: • n is the number of data pairs separated by distance h • z(ui) and z(ui+h) are the data values at locations separated by distance h γ (h) =
Spherical model Range Sill Nugget Ordinary Kriging • There are three primary parameters that describe the autocorrelation of radon concentrations. These are range, nugget and sill. • The range is where the best-fit line starts to level off, (46.55). Within the range, all data are correlated. • The maximum semivariogram value is sill parameter(0.2869) • Nugget is data variation due to measurement errors (0.20487).
Inverse Distance Weighting (IDW) • IDW interpolation assumes that things close to one another are more alike than those farther apart. • To predict a value for any unmeasured location, IDW will use the measured values surrounding the prediction location. • Measured values closest to the prediction location will have more influence on the predicted value than those farther away. • IDW assumes that each measured point has a local influence that diminishes with distance.
Inverse Distance Weighting • A simple IDW weighting function, as defined by Shepard, is : Where w(d) is the weighting factor applied to a known value d is the distance between known and unknown values p is the power parameter (most common value is 2). • A general form of interpolating a value using IDW is:
Radial Basis Function (RBF) • RBF is an exact interpolation technique in the sense that, the surface created must go through each measured sample value. • It is similar to IDW, except that it predicts values above the maximum and below the minimum measured values.
Global Polynomial Interpolation • Global polynomial interpolation technique fits a plane through the measured data points. A plane is typically a polynomial.
Local polynomial Interpolation • While Global Polynomial interpolation fits a polynomial to the entire surface, Local Polynomial interpolation fits many polynomials, each within specified overlapping neighborhoods.
Evaluation Criteria • Several statistical indicators (Root Mean Square Error (RMSE), Mean Error (ME), Mean Absolute Error (MAE) and Mean Square Error (MSE)) are computed on observed and predicted radon concentrations. • Confidence limits on the statistics for NormalizedMean Square Error (NMSE), Fractional Bias (FB),and Coefficient of Correlation (r) are calculated using Bootstrap application to identify the most suitable interpolation technique.
ResultsMeasured Vs Predicted Radon Conc. Values for the test datasets
ResultsMeasured Vs Predicted Radon Conc. Values for test datasets
ResultsME, MAE, MSE and RMSE values of different interpolation techniques for geometric mean of radon concentration test predictions
ResultsSummary of Robust and Seductive 95% Confidence Limits Analyses on Each Technique Note: X indicates significantly different from zero. Blank indicates not significantly different from zero.
ResultsSummary of Robust and Seductive 95% Confidence Limits Analyses among Each Technique Note: Yes- Indicates significantly different from zero. No- Indicates not significantly different from zero
Comparison of the behavior of the prediction maps with the soil uranium concentrations map
Comparison of the behavior of the prediction maps with the soil uranium concentrations map
ResultsPredicted Geometric Mean of Radon Concentrations Using Ordinary Kriging technique for Lucas County
Conclusion • Prediction maps were created using the training data set for all five interpolation techniques and projected values were estimated for the test data set. • Statistical parameters (error values) were evaluated and the prediction maps generated from these techniques were compared to the soil uranium concentration map. • It was inferred that any of the four (Ordinary Kriging, IDW, RBF and Local Polynomial) interpolation techniques can be used for predicting the radon concentrations for unmeasured zip codes. • Ordinary Kriging technique was chosen and the geometric means of radon concentrations were evaluated for unmeasured zip codes.
Conclusion • From the data sets available prior to study, number of zip codes having geometric mean of radon concentration over 4.0 pCi/l is 390. • After using the Ordinary Kriging interpolation technique to calculate the predictions for unmeasured zip codes, number of zip codes having radon concentration over 4.0 pCi/l is 688. • The predicted radon concentrations for unmeasured zip codes were found to be below 8 pCi/l. • Therefore, for the cases where the geometric mean of radon concentration exceeds 8 pCi/l and 20 pCi/l, the number of zip codes from existing data is equal to that obtained by interpolation technique for unmeasured zip codes (85 and 9 for the respective cases).