Download
1 / 24
240 likes | 627 Views
A configuration example from the field. Hi, The server now performs as it should, with response times at max 4-5 seconds compared to earlier 20 -30 seconds. We did as you told us: On the server we upgraded BIOS version to 02/02/2011 We changed the following BIOS settings:

E N D
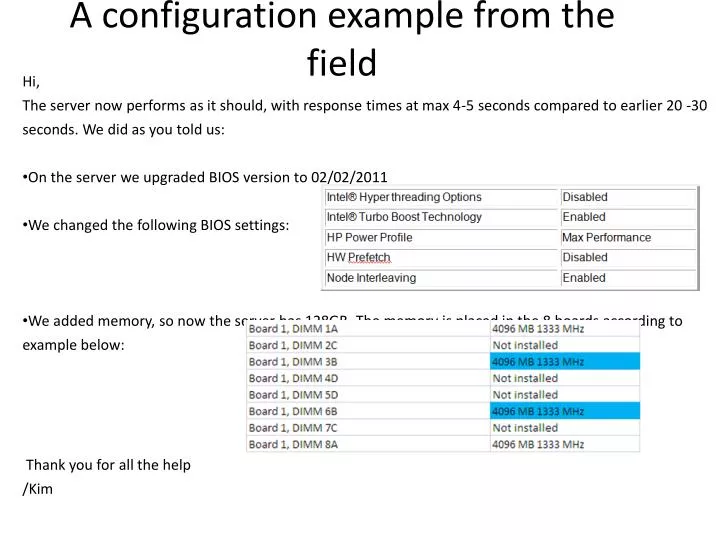
A configuration example from the field Hi,The server now performs as it should, with response times at max 4-5 seconds compared to earlier 20 -30 seconds. We did as you told us: On the server we upgraded BIOS version to 02/02/2011 We changed the following BIOS settings: We added memory, so now the server has 128GB. The memory is placed in the 8 boards according to example below: Thank you for all the help/Kim
NUMA (Non-Uniform Memory Access), how does it work? • Each processor have access its own local (and fast) memory, called a NUMA node 1 . . . . . . 99 100 . . . . . . 199 • Access to non-local memory (another NUMA node) will be slower • Linear memory access (or NUMA) defines the memory on all nodes sequentially
NUMA and SUMA benchmarking • NUMA Enable, Max response time is 50 ms • NUMA Disabled (SUMA), Max response time is now 1,8 ms
NUMA • QlikView Server is not NUMA aware and performance will be degraded when NUMA is activated • If NUMA is enable it’s shown in Task Manager • Windows operating system controls memory distribution between the NUMA nodes. • This could explain the extremely bad performance results using NUMA!?
Disable NUMA • Node interleaving (or SUMA) will address the memory across all the memory slots. 2 . . . . . . 199 1 . . . . . . 198 • Memory allocation and access is spread across the nodes. • The isolated NUMA nodes will stop to exist • Change in Bios to NUMA=Disable, Node interleaving=True or SUMA
How does Node Interleaving perform? • Dell have done performance tests on a R610 server • In NUMA mode local memory is fast (9Gb/s) and remote memory is slower (6,5Gb/s) • When using Node Interleaving the performance on total memory will become something in-between local and remote (8GB/s)
Memory configuration • Fast memory access is extremely important for QlikView Server to get max performance • Memory alignment: Align memory in the slots according to vendor instructions • Memory frequency and size: Use DDR3,1333 MHz and on supported servers DDR3-1600 MHz or 1866 MHz Never mix different memory size and speed • Memory bus speed:Faster CPU’s will have a higher bus speed • Hemisphere Mode:This mode allows interleaving between a processor’s two memory controllers (Hemispheres) leading to improved performance on the memory buses. • Requires identical memory configuration across all memory controllers. • Hemispheric mode is only available on CPU’s with two memory controllers. • Read server manual for detailed information
Energy saving settings • Use Resource Monitor to identify if energy saving settings is active • NUMA Disabled (SUMA), Max response time is 1,8 ms • Modern processors only work at 60% efficiency when energy saving is turned on • By activating Turbo Boost you will gain 3% to 9% extra CPU cycles • Energy and Turbo boost settings are changed in Bios • Disadvantage is the electric bills
Other possible hardware tweaks • Hyper threading • Two threads on each core instead of one • Scalibility Center have noticed a QlikView Server performance degrading when using hyper threading • On smaller servers and laptops hyper threading could have a positive effect. • Hardware prefetch • Processors is able to prefetch extra cache lines for every memory request • Have no measured performance benefit for QlikView Server • Could have a negative effect when QlikView Server fetching memory by loading the buss with unwanted requests.
Hardware SizingCharacteristics of Platforms • 4/8 –socket servers • Advantages • Due to the amount of total cores better handling of many user sessions - for large user communities • RAM- scalability (2 TB) => many applications , many users , big cache • Low SW costs (only 1 QVS license needed) • Disadvantages • Expensive from the beginning • Lot of initial memory is needed for correct alignment (“Hemispheric Mode”) • No failover • Very big servers (8-socket via external interlink connections and mandatory NUMA mode) will have performance problems due to higher RAM access latencies
Hardware Sizing Servers tested by Scalibility Center Small Servers with 2 CPU sockets Big Servers with 4 CPU sockets Very Big Servers with 8 CPU sockets Intel XEONs X5675-5690HP ProLiant DL380 G7Dell R610 / R710 IBM x35nn / x36nn M3 • Intel XEON X7560 and E-4870Nehalem EX • HP DL580 G7 • Dell R810 / R910 / DL980 • IBM x3850 / x3950 X5 Intel XEONs X75xx and E-88xxHP DL980 G7 PREMAIBM x3850 / x3950 X5 Intel Xeon E5-2690Sandy BridgeHP ProLiant DL380p Gen8 AMD Opteron 61xx and 62xx HP DL385 G7Dell R815IBM x3755 M3 AMD Opteron 2427 HP ProLiant BL465c G6
How does QlikView Server use CPU? • QlikView uses CPU for calculations and memory access • 100% CPU utilization often means that the CPU is trying to retrieve data from memory. This is usually a symptom of slow memory access (or massive amount of data) • Sometimes it looks like the CPU is at 30% to 60% but in reality the CPU is moving lightning fast between 0% and 100%. This when QlikView Server is collecting data from the memory and is a healthy behavior. • A badly optimized function or calculation could utilize only one CPU (single threaded operation). Check task manager CPU usage tab during the test cycle.
QlikView Sizing CPU resources needed - Impact of data modell Relations via link tables Needs more CPU power vs. Concatenatedfacttables Needs less CPU power but sometimesmore RAM
QlikView Sizing CPU resources needed – Impact of formula complexity If…. sum( aggr( ( sum( { $<AGR.Datum={">=$(vStart_Datum_Z)<=$(vEnde_Datum)"}, AGR.IFCNAM={$(=chr(39) & replace(replace( concat( aggr( if( rank( ( sum( {$<AGR.Datum={">=$(vStart_Datum_Z)<=$(vEnde_Datum)"} >} AGR.ChangeRateDiff.kursv)) / (( sum( {$<AGR.Datum={">=$(vStart_Datum_N)<=$(vEnde_Datum)"} >} AGR.Stock.RateV)) / ($(#vChart_Month_Diff_N)) ) ) <6, AGR.IFCNAM),AGR.IFCNAM),','),',','#,#'),'#',chr(39))&chr(39))} >} AGR.ChangeRateDiff.kursv)) ,AGR.InvObjective2)) / sum( aggr( ( sum( { $<AGR.Datum={">=$(vStart_Datum_N)<=$(vEnde_Datum)"}, AGR.IFCNAM={$(=chr(39) & replace(replace( concat( aggr( if( rank( ( sum( {$<AGR.Datum={">=$(vStart_Datum_Z)<=$(vEnde_Datum)"} >} AGR.ChangeRateDiff.kursv)) / (( sum( {$<AGR.Datum={">=$(vStart_Datum_N)<=$(vEnde_Datum)"} >} AGR.Stock.RateV)) /($(#vChart_Month_Diff_N)) ) ) <6, AGR.IFCNAM),AGR.IFCNAM),','),',','#,#'),'#',chr(39))&chr(39))} >} AGR.Stock.RateV))/($(#vChart_Month_Diff_N)) ) ,AGR.InvObjective2) vs. sum( {< Year={$(vPY)} >} Sales.Amount )
QlikView Sizing CPU resources needed - Impact of formula amount 30 expressions in 30 objects Max: 350 Expressions (incl. condition / color formulas) in one sheet! vs. 3 expressions in 1 object
QlikView Sizing CPU resources needed – Impact of user types • Report users • - Direct access to their data section ( the majority of the users have limited rights) • - Less analysis need • Frequent, periodical access to the data of their business • „one“-dimensional views 10 – 30 clicks in one session 0,5 clicks per minute within one hour vs. • Analysis users • - Global, wider view at the data , top down , across many fields • - Often changes attributes, changes data vizalisation , create new filter combinations • Intense but erratic access • „multi“-dimensional views to data 30-120 clicks in one session 2 clicks per minute within one hour
QlikView Sizing CPU resources needed - Other influencing factors • amount of dimensions in pivot tables • cardinality of dimensions in diagramms and also in database • Use of certain functions such as: • type conversions (date,num,dual) • count(distinct) • concat() • aggr() • firstsortedvalue() • rank() • …..
QlikView Sizing RAM Consumption Calculation Example .QVW File Size (in MB) RAM Footprint # Users Concurrent Per User Footprint Total RAM Consumed (MB) 12,000 2,000 200 QVW #1 50 500 44,000 100 400 QVW #2 1,000 4,000 Total: 56,000 File Size is roughly 8% of original data size File Size X 4 is estimated Footprint Size Footprint Size X 10% is estimated Per User Footprint For exact RAM Footprint save application with Compression = None
Design Alternative: Fact Table Concatenation Sales Concatenated Facts Plan Yearly Procurement Cost
Application data model Schema alternatives for models with multiple source fact tables Alternative 2 Alternative 3 Alternative 1 Concatenate facttables Response Time RAM consumption Script run time Flexibility Model Complexity Script
Recommendations For Better Performance • Reduce the amount of simultaneous open chart objects • Calculate measures within the script (model size <> online performance) • Limit the amount of expressions within chart/pivot objects, distribute them in multiple objects (use auto minimize) • Use “minimize” , “calculation conditions” , “show conditional” - user want to select their filters first • Don’t use “Container Object” for diagram objects • Limit the amount of dimensions in Pivot/Table-diagrams - use cycle groups or variables • The dimensions in Pivot-diagrams should be order based on their cardinality, low cardinality to high cardinality = start with the field with less distinct entries
Recommendations For Better Performance • Split timestamp into date and time fields when date and time is needed • Remove time from date by floor() or by date(date#(..)) when time is not needed • Reduce wide concatenated key fields via autonumber(), when all related tables are processed in one script • Use numeric fields in logical functions (string comparisons are slower) • ( a – b ) / b better: ( a / b ) – 1 • date(max(SDATE,'DD.MM.YYYY')) is factor xxx faster than max(date(SDATE,’DD.MM.YYYY’) ) • Is the granularity of the source data needed for analysis? • Replace COUNT(distinct) - Use numeric flags (e.g. with 1 or 0) ,which are pre-calculated in the script • sum( Flag * Amount ) vs. sum( if( Flag, Amount ) ) • In QV following is valid : simple = fast
What’s new in QlikView 11 regarding performance? • Memory allocation algorithm changeQlikView now commits smaller memory blocks when allocating memory. Performance tests have shown that allocating bigger blocks takes time. • Special NUMA disable tweak for systems that can’t turn off NUMA.NumaRoundRobin=1 in c:\ProgramData\QlikTech\QlikView Server\Settings.ini • Enhanced load balancing algorithm (CPU with RAM overload) for QlikView Server clusters • QlikView Server performance has been overall improved in every QlikView version and SR, this is a result of ongoing Scalibility Center testing.
Windows • Use Windows 2008 R2 Enterprise Edition (SR1) • More than 32GB of memory • Windows cluster functionality, good for active passive SAN cluster. • Basic Windows tweaking for QlikView Server • Energy settings need to be turned off • Fixed page file, QVS do not use the page file (20GB is sufficient). • IIS Tweaks • Dynamic compression, install and activate (disabled as default) • Compression algorithms and level (Deflate) • Compression level (Static compression level:9, dynamic compression level:4) • Enable Expire Web content (tells browser to keep site content in offline cache) • Turn off Rapid Fail Protection in QlikView IIS application pool • And more ....