Download
1 / 14
150 likes | 352 Views
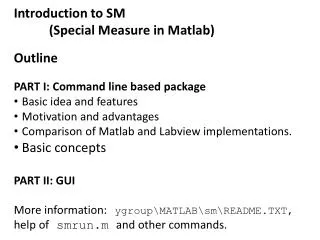
Introduction to SM (Special Measure in Matlab ) Outline PART I: Command line based package Basic idea and features Motivation and advantages Comparison of Matlab and Labview implementations. Basic concepts PART II: GUI More information: ygroup MATLAB sm README.TXT,

E N D
Introduction to SM • (Special Measure in Matlab) • Outline • PART I: Command line based package • Basic idea and features • Motivation and advantages • Comparison of Matlab and Labview implementations. • Basic concepts • PART II: GUI • More information:ygroup\MATLAB\sm\README.TXT, • help ofsmrun.mand other commands.
Basic idea and features • Based on "abstraction" of instruments: Each physical variable can be controlled and read out in the same way. Instrument specific information is (mostly) confined to drivers. • Support of buffered readout, e. g. can read a whole scanline at once. => fast - sample rate hardware limited.=> easier to accommodate hardware controlled measurements. • Command line based low level interface • Optional GUI builds on top.
Advantages of command based approach • Can configure complicated measurements (e.g. ramps, modules) with user defined Matlab functions or scripts. • Can run a series of measurements autonomously. • Rapid code development for specific tasks (don't need to program an edit for every parameter). • Full power of Matlab command line available: e.g. send arbitrary GPIB commands to instruments without further programming. • No GUI related bugs. • Provides basis for GUI => can combine best of both worlds.
Incomplete listing of the most important commands Main routines: smrun.m - 512 lines smset.m - 145 lines smget.m Rarely used low level: smopen.m smclose.m smprintf.m smquery.m smscanf.m smflush.m Display tools smprintchannels.m smprintinst.m smprintrange.m smprintscan.m Setup tools smaddchannel.m smscanpar.m smdiagpar.m smdispchan.m sminitdisp.m smloadinst.m smsaveinst.m smsavechans.m smloadchans.m logsetfile.m Helper functions sminc.m smrestore.m smgetscanconst.m smsetscanconstant.m Internal smchaninst.m smchanlookup.m sminstlookup.m
Most important elements Main measurement command: smrun(scan, ’data_324’) Name of data file. Actual filename will be ‘sm_data_324.mat’. This file will contain the data, a copy of scan, and further configuration data. scan: Structcontaininfg information about scan (#loops, channels, scan range etc.) Defining a measurement: scan = data: [1x1 struct] loops: [1x2 struct] configfn: [1x1 struct] disp: [1x2 struct] saveloop: 2 trafofn: {} Optional user data Information about each loop Optional configuration function (e.g. program inst’s) What data to display and how When to save data Optional global transformation (e.g. for rotated scans)
Fastest loop # of samples Range of dummy variable Channel(s) to be set Time per point. < 0 => use instrument generated ramp. User function to trigger ramp (better synchronization) scan.loops(1)= npoints: 50 rng: [-0.3705 -0.3655] setchan: {'GateR'} getchan: [] trafofn: [] ramptime: -0.0400 procfn: [] trigfn: [1x1 struct] scan.loops(2) = npoints: 40 rng: [-0.3975 -0.3925] setchan: {'GateL' 'GateQPC'} getchan: {'Scope1' 'Scope2'} trafofn: {[] [1x1 function_handle]} ramptime: [] procfn: [1x2 struct] trigfn: [] scan.loops(3) = … Second loop Channel(s) to read Transformation for set channels. Data preprocessing functions
>> smprintscan(scan) Global transformations: ----------------------- Loop 1 ------- x = -0.371 to -0.365, 50 points Channels set : GateR Ramptimes : -4.00e-002 s/point Transform's : Channels read: Loop 2 ------- x = -0.398 to -0.393, 40 points Channels set : GateLGateQPC Ramptimes : NaN s/point NaN s/point Transform's : identity @(x,y)-0.334-1.02*(x(2)+0.405)-0.1*(y(6)+0.250) Channels read: Scope1 Scope2
Instrument and channel configuration global smdata; smdata = inst: [1x13 struct] channels: [1x31 struct] chandisph: 1.0017 chanvals: [1x31 double] configch: [1 2 3 4 5 6 7 8 9 10] configfn: {} smdata.inst(7) = data: [1x1 struct] datadim: [16x1 double] cntrlfn: @smcSR830 type: [16x1 double] device: 'SR830' name: [] channels: [16x5 char] Instruments Channels Last known channel values. Channels to be saved in data file. Functions to be called to read out configuration. Each element represents one physical instrument (e.g. SR830, Yoko, …) User data, typically the interface object. Dimension of data block returned for each channel (# samples per readout) Driver function Type of each channel (1: supports ramps) Device identifier Device name (needed if identifier not unique) List with names of channels provided.
Display instruments: >> smprintinst(6:13) Inst Device Dev. Name --------------------------- 6 TDS5104 7 SR830 8 HP34401A 9 AMI420 10 AWG520 11 HP1000A 12 Aux Feedback Channel configuration Each channel represents one function/variable of some instrument. Index of associated inst and its channel Limits, max ramp rate, conversion factor Channel name. smdata.channels(1) = instchan: [2 2] rangeramp: [-0.6000 0 0.0300 11] name: 'GateQPC'
>> smprintchannels CH Name Device Dev. Name Dev. Ch. ------------------------------------------------- 1 GateQPCDecaDAC RAMP0 2 GateRDecaDAC RAMP1 3 GateLDecaDAC RAMP2 4 Nose DecaDAC RAMP4 5 Tail DecaDAC RAMP5 6 pLDecaDAC RAMP6 7 pRDecaDAC RAMP7 8 GateQPC2 DecaDAC RAMP8 9 VbiasDecaDAC RAMP9 10 B AMI420 FIELD 11 Lockin SR830 X >> smprintrange(7:11) CH Name Min Max Rate (1/s) Factor --------------------------------------------------------------- 7 pR -0.6 0 0.03 11 8 GateQPC2 -0.6 0 0.03 11 9 Vbias -0.001 0.001 0.001 1e+003 10 B -7.9 7.9 0.0033 1 11 Lockin -InfInfInf 1
GUI Provides an environment similar to the LabView Special Measure Front Panel
GUI Functions • Setting up simple scans • Ramps, linear sweeps, etc. • Only supports single scans for now • Editing previously created scans • Change ranges, channels, etc. • Log data to Powerpoint
1/27/2009 11:55 PM Rxx_107.mat LockinFreq = 11 R_{23 1 3 2} I = 4 nA No preamp