Download
1 / 42
420 likes | 509 Views
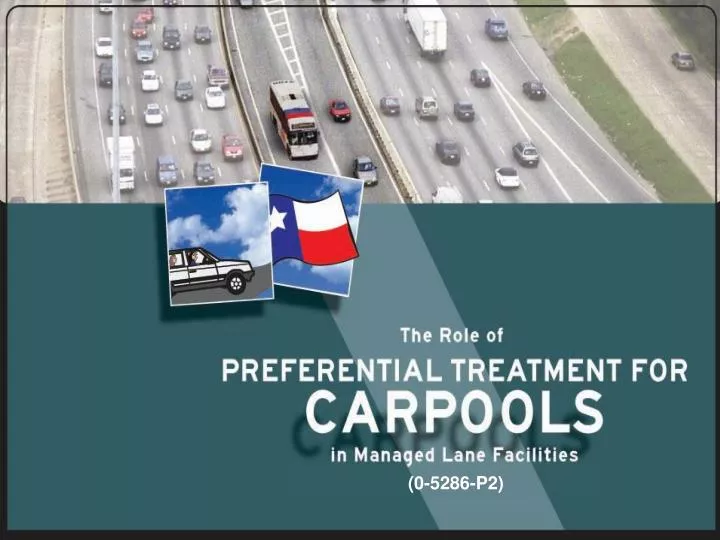
(0-5286-P2). Presentation Structure. Research Objectives Research Process Findings Next Steps. Overview of Topics. State-of-the-Practice Carpool preference policy alternatives (slide 6) Factors considered in setting policies (slide 7) Survey Results

E N D
Presentation Structure • Research Objectives • Research Process • Findings • Next Steps
Overview of Topics • State-of-the-Practice • Carpool preference policy alternatives (slide 6) • Factors considered in setting policies (slide 7) • Survey Results • Personal travel patterns (slides 18. 19, 20, 21) • Managed Lane opinions (slides 23, 24) • Stated preference on mode choice (slides 26, 27, 28) • Survey findings (slides 29, 30) • Empirical Analysis • Case study of 91 Express Lanes, CA (slide 31) • Impact Analysis • Hypothetical Case Study (slide 32) • Analysis of alternative carpool preference policies (slide 33) • Operations (slide 34) • Person Throughput (slide 35) • Revenue (slide 37) • Emissions – CO2 (slide 39) • Comparison of Alternative HOV Policy Scenarios (slide 40) • Overall Findings (slide 41) • Policy Considerations (slide 42)
Research Objective:Evaluate the tradeoffs associated with carpool preferences in Managed Lanes • Explore causal relationship between HOV pricing incentives and the propensity to carpool • Document state-of-the-practice in carpool preferences • Identify tradeoffs associated with preferential treatment
Research Process PMC+ Input State-of-Practice Review Survey Impact Analysis Tool Survey Results • Implementation • Products: • Decision Framework • Webinar • PowerPoint and Brochure Observational Conclusions
State-of-the-Practice Results • Limited information about carpool incentives in priced Managed Lanes • Current facilities provide free access to HOV3+, many offer HOV2+ free • Factors considered in setting policy: • Enforcement of carpools vehicles • Maximizing vehicular throughput • Uniformity and equity considerations • Apparent disconnect between regional carpool program objectives and ML policies
Survey • May to July 2006 • Houston and Dallas • Toll and HOV facilities • Primarily web-based • Questions Regarding • Personal travel patterns • Managed Lane opinions • Stated preference on mode choice • Demographic information
Data Collection • Primarily collected on-line • English and Spanish • Widely advertised and many organizations provided web links • Resulted in over 4000 valid responses, but too few from minority and low income respondents
Data Collection • Additional responses from selected community centers and DPS offices • Required both paper and laptop options
The Bottom Line… • Our sample: • Under-represented minority and low-income travelers • Over-represented toll road users • Weighted our results to better represent Houston and Dallas traveler characteristics by: • 4 income groups • 4 ethnic groups • Toll versus non-toll road travelers
Weighting Factors for Dallas Respondents Who Used Toll Roads
Reasons for Mode Choice • Why Do People Carpool? • Why Don’t People Carpool? • Why Do People Use Transit?
Reasons for Carpooling * 5 = very important to 1 = not at all important
Types of Carpools 5.6 minutes average formation time
Interest in Managed Lanes With Managed Lanes a freeway would have two types of lanes as shown below. • There would be toll free lanes - but they may be congested. • There would also be new Managed Lanes added to the freeway where a toll would be charged but those lanes would not be congested. The toll would be collected electronically so there would be no toll booths. There might also be toll discounts or free travel in the Managed Lanes for carpools and buses. Would you be interested in using Managed Lanes?
Data Analysis Travelers with different trip purposes and modes also showed strong interest in the ML concept. The lowest level was transit riders with 60% interest in MLs.
Data Analysis What reasons do travelers give for preferring or not preferring MLs? • Top ranked reasons why respondents would use the MLs: • Able to travel faster than GPLs • Travel time reliability • Top ranked reasons why respondents would not use the MLs: • Other • Do not want to pay the toll • Other was dominated by one theme – “My taxes already pay for the roads”
Stated Preference Questions • Respondents selected between MLs and GPLs • Different • Occupancy levels (SOV, HOV2, HOV3+) • Tolls • Travel times • Resulted in the models Ginger will be discussing
Survey Results • With the planned ML in Texas, providing preferential treatment to HOVs is a significant issue. • The web survey provided a cost-effective survey method, but required follow up for some groups. • Overall, a lot of interest in MLs (approximately 70%).
Survey Results • Little difference in ML interest by city or trip purpose • Interest jumped as income >$100,000 • Current toll road users were more likely to be interested in using MLs • Travel time savings and reliability were highest rated reasons for ML use • Tolls and “roads already paid by my taxes” were the main negative aspects
Empirical Results • Case study of SR 91 Express Lanes • One of the only facilities where effects of price change on carpooling can be measured • Findings • Overall percentage of vehicles in traffic stream decreased by small amount when HOV3+ charged • However, this amount represented a significant portion of HOV3+ • True for both scenarios, where preference suspended and resumed • Elimination of preferential treatment decreased use of HOV3+ while increasing revenue
Impact Analysis - Modeling • Purpose • Develop quantitative values for various measures of effectiveness • Modeling tool • UTA’s Toll Pricing Model (TPM) 3.1 • Driver decisions • Stated preference survey data used to develop model for predicting mode choice in priced lanes • Corridor analyzed • IH-30 under high volumes • Peak hour analysis, no trucks
HOV Policy Scenarios 4 SOV price scenarios Low: $0.10/mile Medium: $0.25/mile High: $0.50/mile Optimized for 60 mph in MLs: $0.37 - $0.45 per mile
Overall Findings • HOV preferences in Managed Lanes can influence carpooling behavior • Family member carpools make up the vast majority of carpools • HOV access rates high in “fampool” responses • Support for Managed Lanes is high in Texas cities that currently have both toll roads and HOV lanes, and “faster travel” and “travel time reliability” were the most important reasons for support • There may be more to gain in person-moving capacity with policies that emphasize HOV preference • The determination of the appropriate HOV policy in Managed Lanes depends upon individual project objectives
HOV Policy Considerations • Existing HOV policies • Regional ridesharing objectives • Facility performance objectives