Trends in Mammography Utilization Among Women by Race and Poverty Status (1990 vs 2010)
This chart presents data on the percentage of women over 40 receiving mammography by race and poverty status for the years 1990 and 2010. It highlights disparities in mammography rates among different racial groups, including White, Black, and Asian women, and examines the impact of poverty status, defined by federal poverty limits. The source of the data is the National Center for Health Statistics (2013). Understanding these trends is crucial for addressing healthcare access and promoting early detection of breast cancer.

Trends in Mammography Utilization Among Women by Race and Poverty Status (1990 vs 2010)
E N D
Presentation Transcript
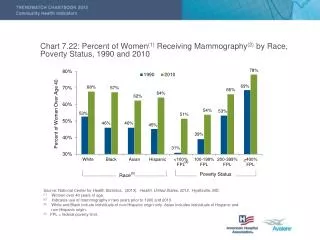
Chart 7.22: Percent of Women(1) Receiving Mammography(2) by Race, Poverty Status, 1990 and 2010 _ (4) Poverty Status Race (3) Source: National Center for Health Statistics. (2013). Health, United States, 2012. Hyattsville, MD. (1) Women over 40 years of age. (2) Indicates use of mammography in two years prior to 1990 and 2010. (3) White and Black include individuals of non-Hispanic origin only. Asian includes individuals of Hispanic and non-Hispanic origin. (4) FPL = federal poverty limit..