Download

1 / 21
210 likes | 299 Views
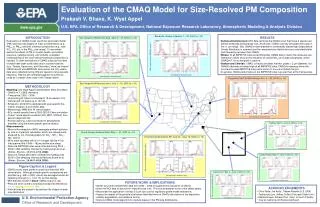
Summary of CMAQ model evaluation for Secondary Organic Aerosols in the Southeastern U.S., including precursor contributions and performance analysis. Discusses comparison with observations, tracer-based estimates, and model enhancements.

E N D
Evaluation of CMAQ for Precursor-Specific Contributions to SOA in the Southeastern U.S. Prakash Bhave, Ann Marie Carlton, Sergey Napelenok, Tad Kleindienst, John Offenberg, Michael Lewandowski, Mohammed Jaoui CMAS Conference Chapel Hill, NC October 19 – 21, 2009
Overview • Background • Previous evaluations of CMAQ organic aerosol • Revised SOA treatment in CMAQ v4.7 • Evaluation of current CMAQ results
Across eastern U.S., CMAQ underpredicts OC & TC at most sites by ~1 μgC m-3 during summer factor of ~2 or more at many sites CMAQ v4.5 Evaluation – OC & EC Median Bias (μgC m-3) Summary of performance at all eastern U.S sites in 2001.Ref: K.W. Appel, et al. (2008), Atmos. Environ. 6057-6066.
Model Eval. – POA tracers (Jul’99) Modeled ÷ Observed Concentration Bhave, Pouliot, & Zheng, Environ. Sci. Technol. (2007)
Radiocarbon Measurements (14C) • Technique takes advantage of fact that 14C isotope is absent in fossil fuels • PM2.5 samples collected at Nashville on June 21 – July 13, 1999 were analyzed for 14C C.W. Lewis et al., Atmos. Environ. (2004)
MSP sampler CMAQ 24h-avg Fireworks Excluding July 4th influence, MB = -0.6 mg/m3 MB = Mean Bias Model Eval. – Fossil-Fuel Carbon
MSP sampler Fireworks CMAQ 24h-avg Excluding July 4th influence, MB = -2.3 mg/m3 MB = Mean Bias Model Eval. – Contemporary Carbon
Legend: CMAQ results = solid line; empirical estimates = dashed line OCsec is underestimated in the Southeast during summer OCsec is overestimated in the west-coast states OCsec [mg/m3] Model Evaluation – OC/EC Ratio Yu, Bhave, Dennis, & Mathur, Environ. Sci. Technol. (2007)
Tracer-Based Estimates of SOC Tracer-based method for estimating source contributions to ambient SOC • Lab Experiments • Smog chamber irradiations of numerous VOC/NOx mixtures • Identified and quantified unique tracer compounds (e.g., methyl tetrols) using advanced GC/MS methods. • Computed tracer/SOC ratios for each SOA precursor (# tracers = 3 isop, 9 mono., 1 sesq., 1 arom.) • Field Measurements • Collected 33 PM2.5 samples in RTP throughout 2003 (2 – 5 day duration) • Quantified the same tracer compounds that were found in the chamber studies. • Estimated ambient SOC contribution from each VOC precursor, using the tracer/SOC ratios. • See Kleindienst et al. (Atmos. Environ., 41: 8288-8300, 2007) for details. Greatest source of uncertainty: - Are the tracer/SOC ratios measured in the chamber equal to those in the atmosphere? Approach: - Accept the tracer estimates at face value until better information becomes available.
Tracer-Based Estimates CMAQ v4.6 Results Secondary Organic Carbon (μgC m-3) CMAQ v4.6 had… • the wrong seasonal cycle for total SOC • too much monoterpene SOC (especially in Spring & Fall) • not enough aromatic SOC • no isoprene or sesquiterpene SOC(also noted by Morris et al., 2006) Kleindienst, Jaoui, Lewandowksi, Offenberg, Lewis, Bhave, & Edney, Atmos. Environ. (2007)
Organic PM2.5 cloud water ∙OH SV_ALK long alkanes SV_TOL1 SV_TOL2 ∙OH/NO AALK high-yield aromatics ∙OH/HO2 AORGC ATOL1, ATOL2 SV_XYL1 SV_XYL2 low-yield aromatics AOLGA ∙OH ∙OH/NO dissolution AXYL1, AXYL2 ATOL3 ∙OH/HO2 AXYL3 ABNZ1, ABNZ2 SV_BNZ1 SV_BNZ2 ABNZ3 ∙OH/NO glyoxal methylglyoxal POA benzene AOLGB ATRP1, ATRP2 ∙OH/HO2 SV_TRP1 SV_TRP2 ASQT AISO3 ∙OH,O3 O3P, NO3 H+ monoterpene AISO1, AISO2 SV_SQT VOCs ∙OH,O3, or NO3 ANTHROPOGENIC EMISSIONS sesquiterpenes BIOGENIC EMISSIONS SV_ISO1, SV_ISO2 ∙OH isoprene EMISSIONS EMISSIONS EMISSIONS Pathways do not contribute to SOA O3,O3P, or NO3 Non-volatile CMAQ v4.7
Did It Make a Difference? CMAQ v4.6 new SOA treatment Secondary Organic Carbon (μgC m-3) • Model results from lowest layer are averaged by month • 36km grid cell containing Research Triangle Park measurement site
Did It Make a Difference? CMAQ v4.6 new SOA treatment Secondary Organic Carbon (μgC m-3) • Model results from lowest layer are averaged by month • 36km grid cell containing Research Triangle Park measurement site
Model Evaluation for 4 SOC Classes Tracer-Based Estimates CMAQ – new SOA • Model results are consistently low (29 out of 33 samples), especially during high-pollution episodes in Summer
Model Evaluation for 4 SOC Classes CMAQ Model Results [μgC m-3] Tracer-Based Estimates [μgC m-3]
Despite significant updates, CMAQ results still fall short of observed SOC in Southeast during Summer Missing isoprene SOC May be due to insufficient in-cloud formation Missing aromatic SOC May require a VBS approach Monoterpene & sesquiterpene SOC are in the right ballpark Preliminary results from Midwest: All 4 SOC types underestimated from May – Sept. See poster by Napelenok et al. References Appel, K.W.; Bhave, P.V.; Gilliland, A.B.; Sarwar, G.; Roselle, S.J. Evaluation of the Community Multiscale Air Quality (CMAQ) Model Version 4.5: Sensitivities Impacting Model Performance; Part II – Particulate Matter, Atmospheric Environment, 2008, 42:6057-6066. Bhave, P.V.; Pouliot, G.A.; Zheng, M. Diagnostic Model Evaluation for Carbonaceous PM2.5 Using Organic Markers Measured in the Southeastern U.S., Environmental Science and Technology, 2007, 41:1577-1583 Bhave, P. Yu, S.; Lewis, C. Evaluation of a Model for Predicting the Fossil-Fuel and Biogenic Contributions to Fine Particulate Carbon, American Association of Aerosol Research, 11B1, Austin, October 2005 Kleindienst, T.E.; Jaoui, M., Lewandowski, M.; Offenberg, J.H.; Lewis, C.W.; Bhave, P.V.; Edney, E.O. Estimates of the Contributions of Biogenic and Anthropogenic Hydrocarbons to Secondary Organic Aerosol at a Southeastern US Location, Atmospheric Environment, 2007, 41:8288-8300 Yu, S.; Bhave, P.V.; Dennis, R.L.; Mathur, R. Seasonal and Regional Variations of Primary and Secondary Organic Aerosols over the Continental United States: Semi-empirical estimates and model evaluation, Environmental Science and Technology, 2007, 41: 4690-4697 Summary
Site Location – Aerial Photo RTP sampling site located at 35.894ºN and 78.877ºW
Site Location – Gridded Map w. Counties MM5 Land Use Categories Site is in NE corner of grid cell (121,50); ~4km from nearest neighboring cell. LEGEND Mixed ForestCropland/Woodland MosaicEvergreen Needleleaf ForestDryland Cropland and PastureDeciduous Broadleaf Forest