Download
1 / 66
660 likes | 689 Views
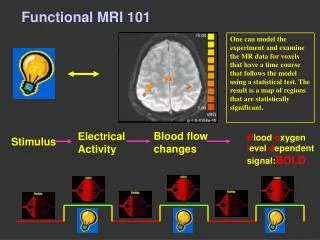
Starting up a Functional MRI Center. Peter A. Bandettini, Ph.D Unit on Functional Imaging Methods & 3T Neuroimaging Core Facility Laboratory of Brain and Cognition National Institute of Mental Health. Technology. Methodology. Interpretation. Applications. Technology. Methodology.

E N D
Starting up a Functional MRI Center Peter A. Bandettini, Ph.D Unit on Functional Imaging Methods & 3T Neuroimaging Core Facility Laboratory of Brain and Cognition National Institute of Mental Health
Technology Methodology Interpretation Applications
Technology Methodology Engineers Statisticians Physicists Mathematicians Neuroscientists Clinicians Physiologists Interpretation Applications
Diff. tensor Technology Mg+ 7T 1.5T,3T, 4T EPI on Clin. Syst. Venography Real time fMRI EPI SENSE Nav. pulses Local Human Head Gradient Coils Quant. ASL Z-shim Baseline Susceptibility MRI Dynamic IV volume Spiral EPI ASL Current Imaging? BOLD Simultaneous ASL and BOLD Multi-shot fMRI Correlation Analysis CO2 Calibration Methodology Motion Correction Parametric Design Multi-Modal Mapping Surface Mapping Baseline Volume Free-behavior Designs Phase Mapping Mental Chronometry Linear Regression IVIM Deconvolution Event-related BOLD models PET correlation Interpretation IV vs EV ASL vs. BOLD Bo dep. Pre-undershoot PSF of BOLD TE dep Resolution Dep. Extended Stim. Blood T2 Post-undershoot Metab. Correlation Linearity SE vs. GE CO2 effect Optical Im. Correlation Hemoglobin Fluctuations NIRS Correlation Balloon Model Electrophys. correlation Inflow Veins Complex motor Applications Memory Imagery Emotion Language Children Drug effects Motor learning Tumor vasc. BOLD -V1, M1, A1 Presurgical Ocular Dominance Attention Volume - Stroke Clinical Populations V1, V2..mapping Priming/Learning D Volume-V1 Performance prediction Plasticity Face recognition 36 82 88 89 90 91 92 93 94 95 96 97 98 99 00 01 02
Purchasing a scanner • Data handling • Subject interface devices • Data processing • Personnel
Purchasing a scanner • Data handling • Subject interface devices • Data processing • Personnel
Purchasing a scanner -field strength -manufacturer -service -rf receivers (number and bandwidth -field homogeneity -stability -shimming -gradient homogeneity -gradient performance -programming environment -real time? -service contract -other centers with the scanner
What Changes with Field Strength? Tissue Relaxation Characteristics Functional Contrast Signal to Noise Ratio Bo Inhomogeneity Effects RF Power Deposition Mechanical Force on Gradient Coil
T1 Values Across Field Strengths T2* Values Across Field Strengths 2500 80 70 2000 60 T1 White T2* White Matter 50 1500 T2* (ms) T1 (ms) T1 Gray 40 T2* Gray Matter 1000 30 T1 Blood T2* Blood 20 500 10 0 0 0 2 4 6 8 0 2 4 6 8 Field Strength (Tesla) Field Strength (Tesla)
T2 Values Across Field Strengths 120 100 80 Matter T2 (ms) 60 T2 Gray T2 Blood 40 20 0 0 2 4 6 8 Field Strength (Tesla)
UIC Thulborn Whole Brain Anatomy T1-SET2-FSEFLAIR 1.5T 3.0T
UIC Thulborn 3.0T: 3D TOF MRA Longer T1 at 3.0T enhances flow effects and improves background suppression as well as allows higher spatial resolution 15 y.o. female patient 57 y.o. male patient
T2* Values Across Field Strengths 80 70 60 T2* White 50 T2* (ms) 40 T2* Gray 30 T2* Blood 20 10 0 0 2 4 6 8 Field Strength (Tesla)
1.5T 3T 1.5T 3T
Gradient-Echo EPI Spin-Echo EPI
Asymmetric Spin - Echo Gradient - Echo
Asymmetric Spin - Echo Gradient - Echo
Asymmetric Spin - Echo Gradient - Echo
Contrast depends on: activation-induced changes in T2* and resting T2* T2* T2*
Contrast depends on: activation-induced changes in T2* and resting T2* T2* T2*
Gradient echo Signal Loss 3 Tesla, 6464, TE=30ms, thk=6mm Signal loss map 0% 50% 100%
Arterial inflow (BOLD TR < 500 ms) Venous inflow (for ASL, w/ no VN) Pulse Sequence Sensitivity Spatial Heterogeneity
A few slides about Image Resolution and Noise…
T2* decay EPI Window 1 Multishot Imaging T2* decay EPI Window 2
Multi Shot EPI Excitations 1 2 4 8 Matrix Size 64 x 64 128 x 128 256 x 128 256 x 256
T2* decay EPI Window Partial k-space imaging
Partial k-space imaging Jesmanowicz, P. A. Bandettini, J. S. Hyde, (1998) “Single shot half k-space high resolution EPI for fMRI at 3T.” Magn. Reson. Med. 40, 754-762.
Temporal vs. Spatial SNR- 3T 26ms 49ms 26ms 49ms SPIRAL 27ms 50ms 27ms 50ms EPI
0.25 Hz Breathing at 3T 3ms Image 26ms Respiration map Power Spectra 49ms 0 0.25 0.5 Hz
0.68 Hz Cardiac rate at 3T 3ms Image 26ms Power Spectra Cardiac map 49ms 0 0.68 (aliased) 0.5 Hz
1000 800 600 400 200 0 200 400 600 800 1000 Temporal S/N vs. Image S/N PHANTOMS SUBJECTS 1400 1200 1000 800 600 400 200 Temporal S/N Temporal S/N 0 200 400 600 800 1000 1200 1400 Image S/N Image S/N N. Petridou
Temporal vs. Image S/N Optimal Resolution Study Human data Petridou et al
Temporal vs. Image S/N Optimal Resolution Study Phantom data Petridou et al
Signal / Thermal Noise Signal / Physiologic Noise Signal to Noise Ratio Optimal for fMRI Resolution, Speed, Surface Coils, Field Strength, etc..
Ocular Dominance Column Mapping using fMRI calcarine Menon, R. S., S. Ogawa, et al. (1997). “Ocular dominance in human V1 demonstrated by functional magnetic resonance imaging.” J Neurophysiol 77(5): 2780-7. Optical Imaging R. D. Frostig et. al, PNAS 87: 6082-6086, (1990).
Imaging System Components Magnet RF Receiver Viewing Console X Y Z RF Transmitter Scan Controller Gradient Power Systems