Download
1 / 49
490 likes | 603 Views
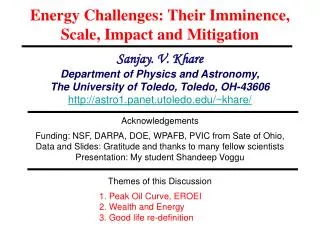
Energy Crises: Their Imminence, Size, Impact. Sanjay. V. Khare Department of Physics and Astronomy, The University of Toledo, Toledo, OH-43606 http://www.physics.utoledo.edu/~khare/. Four Distinct Crises. Peak Liquid Fuels. Best estimates of future world oil production. Peak Total Energy.

E N D
Energy Crises: Their Imminence, Size, Impact Sanjay. V. Khare Department of Physics and Astronomy, The University of Toledo, Toledo, OH-43606 http://www.physics.utoledo.edu/~khare/
Peak Liquid Fuels Best estimates of future world oil production
Peak Total Energy Total Energy Use, 1965 to 2050 (Courtesy: Paul Chefurka)
Net Surplus Energy (NSE) TM = Total mass of energy providing material e.g., oil, coal, gas, wind turbine, PV modules EPM = Energy produced per unit mass NSE = TM X EPM (Naive Calculation) Correct Calculation EROEI= Energy Returned on Energy Invested = NSE = TM x EPM x EROEI = TM x EPM x We are running out of TM and EROEI
Thank You • References: • www.theoildrum.com • www.energybulletin.net • www.aspo-usa.org • Beyond Oil: The View from Hubbert's Peak; By Kenneth S. Deffeyes • Out of Gas: The End of the Age of Oil; By David Goodstein • Twilight in the Dessert; by Matthew R. Simmons
Solar Energy of Commercially-Available Thin Film Technologies, a-Si most clearly has no fundamental material limitations
Crystalline PV production rate expected to slow over next few years due to silicon shortage. Thin film PV production rate expected to continue to increase.
One aspect of energy quality: a comparison of the energy content per unit mass and per unit volume for various sources.
“Balloon graph” representing quality (y graph) and quantity (x graph) of the United States economy for various fuels at various times. Arrows connect fuels from various times (i.e. domestic oil in 1930, 1970, 2005), and the size of the “balloon” represents part of the uncertainty associated with EROI estimates.(Source: US EIA, Cutler Cleveland and C. Hall’s own EROI work in preparation)
Power Density Power densities for fossil and renewable fuels. (Source: Smil, V. 2006. ''21st century energy: Some sobering thoughts.'' OECD Observer 258/59: 22-23.)
Energy Surplus The energy return on investment (EROI) for various fuel sources in the U.S. (Source: Cutler Cleveland)
Energy and basic human needs. The international relationship between energy use (kilograms of oil equivalent per capita) and the Human Development Index (2000). (Source: UNDP, 2002, WRI, 2002)
Peak may have occurred about time of Hurricane Katrina (2005)
Many oil fields, countries, and oil companies have already peaked. • The US peaked in 1970. • 53 of 68 oil producing countries are in decline.
Oil discoveries in the US peaked- then 40 years later production peaked The US lower 48 states Adapted from Collin Campbell, University of Clausthal Conference, Dec 2000
If the world follows the US pattern: …theworld would peak soon Adapted from: Richard C. Duncan and Walter Youngquist
There’s no more spare capacity in the world supply Spare capacity = how much extra oil can be produced within 30 days notice and maintained for 90 days Adapted from “The Oil Age is Over”, Matt Savinar
Spurious OPEC Reserve Revisions
The life support pie is shrinking: The foundation of all agriculture, the soil, is diminishing in all parts of the world Forests are disappearing Aquifers are being pumped dry Fisheries are being decimated Biodiversity is being extinguished Rivers are drying up
Fossil Fuel and Agriculture • Farming “is an annual artificial catastrophe, and it requires the equivalent of three or four tons of TNT per acre for a modern American farm. Iowa's fields require the energy of 4,000 Nagasaki bombs every year.” 1 1 Richard Manning; “The Oil We Eat”, Harpers, 2005. Mr. Manning was referring to the growing of the world’s major grain crops - corn, rice and wheat.
Fertilizer Association of Ireland “World population today stands at 5.8 billion and is expected to increase to 8.0 billion by 2020. Cereals are the world's most important stable nutrient source and to meet future demand cereal production will need to double by the year 2020. Production of other foodstuffs will also have to increase significantly.Fertilizer, both organic and inorganic, will have to play a vital role if the food production necessary to support the increased population is to be provided”.
Saudi saying: “My father rode a camel. I drive a car. My son flies a jet airplane. His son will ride a camel.”
A quad is a unit of energy equal to 1015 (a quadrillion) BTU, or 1.055 × 10¹⁸ joules (1.055 exajoules or EJ) in SI units. • 1018 = exa- (EJ)
American barrel = 158.984 liters = 42 American (US) gallons = 3.78541 cubic decimeters (dm3) = 0.136 tonne (approx) • 1 MMSCF of natural gas = 172.3 barrels of crude oil equivalent = 365 x 1,000,000 scf 1 million cu.ft. of natural gas = 18.91 tons liquid = 1598.69 cu.ft.liquid 1 std.cu.feet of natural gas = 1000 BTU = 252 kilocalories 1 m.ton of coal = 4.879 barrels of crude oil equivalent 1 m.ton of lignite = 2.053 barrels of crude oil equivalent 1 ltr of fuel oil 1500 sec = 38.9 cubic feet of natural gas 1 kg of LPG = 47.0 cubic feet of natural gas 1 normal cu.m. per day (Nm3/d) = 37.33 standard cu.ft. per day (SCFD) [flow rate of gas] 1 ton of LNG = 1.14 1.4 x 10³ normal cu.m.natural (LNG conversions) gas (Nm3) = 52.3 x 10³ standard cubic feet natural gas (SCF) = 55.0 x 10⁹ joules (HHV) 1 ton of LNG = 1.22 tonne crude oil (energy equivalents) = 0.80 tonne heavy fuel oil = 0.91 tonne LPG (commercial composition) = 1.91 tonne coal 1 barrel per day (b/d) = 50 tonnes per year (approx.) 1 barrel of oil equivalent = 1 barrel of crude oil = 5,487 cubic feet of gas ** • Natural gas is converted to barrels of oil equivalent using a ratio of 5,487 cubic feet of natural gas per one barrel of crude oil. This ratio is based on the actual average equivalent energy content of TOTAL's natural gas reserves.