Download
1 / 31
310 likes | 442 Views
This presentation outlines key methodologies and findings from CuraGen's research focusing on gene expression clustering and biological pathways. Joel S. Bader discusses the development of an interior-node test using resampling methods, achieving significant p-values for cluster validation. The talk emphasizes statistical techniques in high-throughput biology, showcasing how clustering overlaps with metabolic pathways and protein-protein interactions. Important applications include disease-related pathways and pharmacogenomics, paving the way for targeted therapies and improved predictive measures in treatment efficacy.

E N D
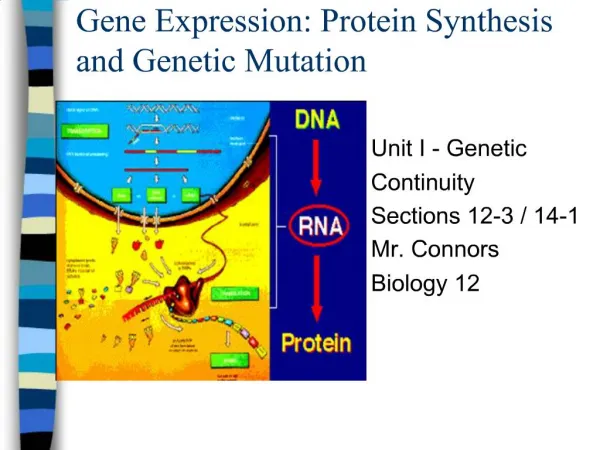
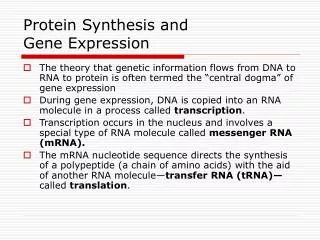
Gene expression and protein pathways Joel S Bader CuraGen jsbader@curagen.com IPAM 2000 Nov 8 CuraGen
CuraGen Background • Product pipeline • Therapeutic proteins • Therapeutic antibodies • Drug targets • Technology • High-throughput biology labs • Bioinformatics/information-intensive CuraGen
Outline • Clustering gene expression data • Interior-node test • Statistical significance • Power • Mapping biological pathways • Metabolic pathways • mRNA coregulation • Protein-protein interactions • Overlaying • Genetic studies • Disease risk • SNPs and association CuraGen
Clustering • Standard method (now) for analyzing gene expression data • Unsupervised algorithms • Run to completion • Clustering eventually driven by noise, not biology • Supervised algorithms • Inconsistent, irreproducible • Not amenable to high-throughput • Goal: automated, unsupervised, with meaningful p-value for clusters produced • Collaboration with Rebecca W Doerge and Brian Munneke, Dept of Statistics, Purdue CuraGen
Hierarchical, distance-based algorithm • Initialize: each gene in a single cluster • Repeat • Join clusters with shortest distance • Re-calculate effective distances • Until 1 cluster remains Neighbor-joining: distance is corrected to be distance between ancestors Studier & Keppler, Mol Biol Evol 5: 729 (1988) Unweighted pair group method arithmetic mean: distance is mean of all pair-wise distances NJ distance UPGMA distance CuraGen
(Typical) results Data taken from X. Wen, …, R Somogyi, PNAS 95: 334 (1998) Large-scale temporal gene expression mapping of central nervous system development 9 time points, embryonic to adult 112 genes Clustering Multidimensional scaling, principal component/factor analysis CuraGen
Raw data and clusters • Set baseline • Normalize columns (time-points) • Log-transform • Subtract row averages (genes) • Neighbor-joining using correlation distance CuraGen
Interior-branch test Parametric based on branch length and variance estimator Branch length error is not normally distributed Small sample size Global test, draws information from entire tree, doesn’t test a node directly Not consistent with neighbor-joining algorithm Bootstrap test Resample data matrix by choosing columns at random with replacement Requires underlying data Computationally intensive Also not consistent with neighbor-joining algorithm Significance tests Our approach: interior-node test using neighbor-joining statistic and permutation/randomization CuraGen
Alternative and null hypotheses Equivalent to interior-branch test for unrooted tree IJKL Test statistic: total length of tree under node X CuraGen
Algorithm Replace nodes A and B with star-trees of terminal taxa Total length = star-tree of A + star-tree of B + branch length AB LA = (NA–1)–1 TAA LB = (NA–1)–1 TBB LAB = (NANB)–1TAB – NA–1LA – NB–1LB Calculate p-value from > 1000 re-assignments of terminal taxa with fixed NA, NB CuraGen
Results, p-value = 0.001 Too liberal Too conservative Too conservative CuraGen
Power estimate Model: Pairwise distance between terminal taxa m and n is dmn = d0 + Imnd + mn I = 0 or 1 if taxa are in same/different cluster H = fraction of pairs across clusters Var() = 2 Expectations: E(LStar) = Nd0/2 + NHd/2 E(LAlt) = Nd0/2 + d Var(LAlt) = [ 1 – (N–2)/2NANB ]22 Power = [(NHd/2) – 2–1/2z] CuraGen
Conclusion • Interior-node test based on resampling • P-value 0.01 to 0.001 gives good results • For just-resolved clusters (distance between ~ standard deviation within), need 8-10 terminal taxa per cluster for significance • Other work • Different clustering algorithms, better power • 2D extensions • PCA, regression, prediction • Applications • Disease-related pathways, target identification/validation • Pharmacogenomics: predictive toxicity, efficacy markers (immediately commercializable) • Exploration of coregulation pathways CuraGen
Mapping biological pathways • Metabolic pathways • mRNA coregulation Red: UpBlue: Down CuraGen
Mapping biological pathways • Metabolic pathways • mRNA coregulation • Protein-protein interactions • Yeast two-hybrid system • Genome-scale survey of yeast • Overview of PathCalling • Comparison of pathways from protein-protein interactions and mRNA correlation • PathCalling bioinformatics: Jim Knight, CuraGen www.curagen.com Nature 403: 623 (2000) Collaboration with Stan Fields CuraGen
PathCalling process Candidate genes Whole-genome ORFS Whole-genome library Bait design Matings Interactions (pairwise links) CuraGen
Results Pairwise interactions built into pathways Infer human pathways by homology CuraGen
Prob(corln) Correlation in expression Comparing Interaction and Expression • Use correlated expression to infer a protein-protein link • What is the overlap between expression links and interaction links? • Yeast expression data from Pat Brown group • Yeast interaction data from CuraGen/Fields Interacting proteins (black line) are slightly more likely to have positive correlation than random ORFs (grey line) Difference is small CuraGen
In progress • Combined visualization of expression/interaction data • Drosophila whole-genome interaction scan (with Rubin group) CuraGen
SNP-based association studies • Cross-validation • Candidate genes from expression • Independent statistical/biological validation • QTLs from genetics • Genetic determinants of complex disease • Risk factors, low penetrance, no clear Mendelian inheritance • Traditional linkage analysis has low power • Association: direct effects of causative mutations • Requirements for association tests • Causative/dense marker set (SNPs) • Large population (1000s to 10,000s) • Cheap genotyping CuraGen
Causative SNPs • Candidates: • Non-cons aa change • Drug target • Disease pathway • Drug metabolism CuraGen
Large populations Cost: 2000 genotypes x 1000 candidates 2 M genotypes target value ~ $1M CuraGen
Allele dose AA Aa aa Cheap genotyping: pooling Selection thresholds (affected/unaffected) Phenotypic value Upper pool Enriched in A Lower pool Depleted in A Measure allele frequency difference between pools CuraGen
Choosing a threshold • Optimization: transform a quantitative phenotype into a qualitative phenotype • How does the optimal threshold depend on • Desired false-positive rate • Population size • Allele frequency • Inheritance mode (dominant, additive, recessive) • What happens when all you have is a qualitative, disease/normal phenotype? • Collaboration with Aruna Bansal and Pak Sham, Gemini Genomics CuraGen
aa Aa,AA aa Aa AA aa,Aa AA Variance components model Biallelic marker A/a Complex trait Dominant: Additive: Recessive: Other QTLs, environmental factors, central limit theorem Standardized total variance = 1 = V(A) + V(D) + V(R) Usually V(R) >> V(A) >> V(D) Phenotypic shift from single QTL Variance = V(A) + V(D) Standard model for QTL mapping, Falconer & McKay CuraGen
Allele dose AA Aa aa Analytic results Selection thresholds Measure allele freq diff Dp y = exp[-F-1(r)2/2]/(2p)1/2 fractionr fractionr Phenotypic value E(Dp) = 21/2y0A/R Var(Dp) = 02/rN N= [z – z1–]2 [VR/VA] /2y2 Geometric factor, 1 for indiv genotyping 1.24 for pooled DNA CuraGen
Relative efficiency Case-control pooling for typical 10% disease incidence is 5X less efficient Population required relative to individual genotyping for same type I and type II error rate Best efficiency at 27% Only 25% less efficient than individual genotyping CuraGen
Population size Genome scan: Type I error 5x10⁻⁸ Type II error 0.2 Lines: exact calculation Dots: analytic formulas V(A) ~ 1 / # genes involved Additive variance is equivalent to a multiplicative haplotype-relative-risk model. Relative risk is calculated at an allele freq of 10% Monogenic trait: V(A) ~ 0.1 or more CuraGen
Applications • Disease-risk markers • 11 major areas • 100s of phenotypes • 1000s of sib-pairs for initial screen • Independent disease-specific follow-up populations • Adverse drug effect markers • Efficacy markers, personalized medicine CuraGen
Summary • Using genomics to improve drug discovery and development • Exploratory analysis of gene expression • Significance thresholds for clustering • Identification of disease/drug-response pathways • Expression-based markers for drug toxicity, efficacy (pharmacogenomics) • Protein pathways • High-throughput PathCalling Y2H system • Overlaying with expression, metabolic pathways • Genetic variation • Large-scale association studies: SNPs, pooled DNA • New targets • Disease-risk, drug-response markers (pharmacogenetics) CuraGen
Acknowledgements • Gene expression • CuraGen’s GeneCalling bioinformatics group: Darius Dziuda, Shu-Xia Li, Ying Li, Yi Liu, John Tobias, Yi Zhao • Prof Rebecca W Doerge and Brian Munneke, Purdue • Protein pathways • Jim Knight (CuraGen) • Large-scale association studies • Pak Sham (Univ of London) and Aruna Bansal (Gemini Genomics) • CuraGen’s genomics facility • We’re hiring jsbader@curagen.com (203)974-6236 CuraGen