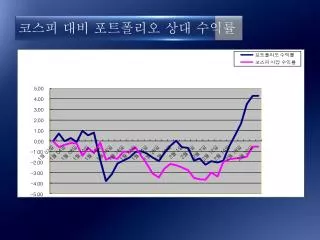
코스피 대비 포트폴리오 상대 수익률
130 likes | 316 Views
코스피 대비 포트폴리오 상대 수익률. 삼성전자 휴대폰 시장점유율 & 영업익. (%). ( 억원 ). 40 30 20 10 0. 40,000 30,000 20,000 10,000. 영업익 ( 좌 ). 시장점유율 ( 우 ). -. 2003 2004 2005 2006 2007 2008 2009 2010 2011 2012. 삼성전자 스마트폰 / 태블릿 , 출하 & 점유율. ( 백만대 ). (%). 400 350 300 250

코스피 대비 포트폴리오 상대 수익률
E N D
Presentation Transcript
삼성전자 휴대폰 시장점유율& 영업익 (%) (억원) 40 30 20 10 0 40,000 30,000 20,000 10,000 영업익(좌) 시장점유율(우) - 2003 2004 2005 2006 2007 2008 2009 2010 2011 2012
삼성전자 스마트폰 /태블릿, 출하 & 점유율 (백만대) (%) 400 350 300 250 200 150 100 50 0 43 38 33 28 23 18 13 8 3 2009 2010 2011 2012E 2013E 2014E 스마트폰 판매량(좌측) 스마트폰 점유율(우측) 태블릿 판매랑(좌측) 태블릿 점유율(우측)
전세계 스마트폰 시장점유율 50% 40% 30% 20% 10% 0% Samsung Apple Nokia HTC RIM ZTE Huawei LG 2009 2010 2011 2012
스마트폰 재료비 구성 기타 20.6% IC 30.0% 윈도우 2.9% PCB 4.2% 배터리 3.9% 카메라 4.7% 디스플레이 15.8% Case/Knob 5.2% 메모리 12.7%
플라스텍 케이스 제조업체 현황 (단위: 억원,%)
플라스텍 케이스 제조업체 현황 (단위: 억원,%)
플라스텍 케이스 제조업체 현황 (단위: 억원,%)