Download

1 / 23
230 likes | 362 Views
A novel active network measurement utility for predicting growth in network traffic. ‘ Etuate Cocker ecoc005@aucklanduni.ac.nz Dr. Ulrich Speidel ulrich@cs.auckland.ac.nz Department of Computer Science , Tamaki Campus , The University of Auckland. Overview.

E N D
A novel active network measurement utility for predicting growth in network traffic ‘Etuate Cocker ecoc005@aucklanduni.ac.nz Dr. Ulrich Speidel ulrich@cs.auckland.ac.nz Department of Computer Science, Tamaki Campus, The University of Auckland
Overview • Voice and data transmissions in low bandwidth and high latency networks (i.e., typical Pacific Islands) • Measurement of jitter for voice and data transmission in high latency and low bandwidth networks
Pacific Island Countries (PICs) • Region spread across 33 million square kilometres of ocean. • Home to 22 countries. Consist of 1118 inhabited islands, many barely above sea level. • Each country has less than 25% of population with access to Internet. Internet available in work places, educational institutions and public facilities. Source: Ministry of Lands in Tonga
International Connectivity in PICs • Internet connectivity is possible with high latency satellite links to TNZI in NZ, TATA in Canada, PACTEL in Australia. • Maximum downlink less than 30Mbps; uplink of approximately 15Mbps for whole country. Customers purchase bandwidth from 56Kbps to 2Mbps. • Fibre optic submarine cables only in few places such as New Caledonia, Fiji, French Polynesia, Hawaii, Guam.
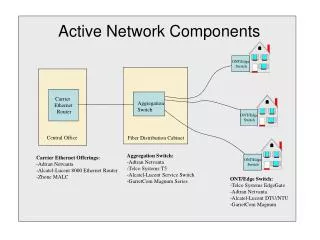
Last Mile Internet Connectivity in Pacific Island Countries • Old routers used to connect to Internet • Updated your firmware lately? • Old computers without antivirus or security updates • Poorly maintained phone cables used to connect customers, with few ADSL subscribers Source: Ministry of Lands - remote solar centre
So… • Old overloaded infrastructure communicates over links with little bandwidth and a lot of unwanted traffic. • Long router queues/high packet loss • Possible multipath on international links • This means: packets that we transmit at regular intervals (such as in a VoIP stream) don't necessarily arrive at regular intervals – or at all • This means VoIP and other real-time protocols don't work that well in the Pacific • Can we measure this objectively?
Our Beacon Network URL: https://130.216.5.147/ Username: csusers Password: cs2013
What the Beacons do • Work in pairs to exchange synthesised traffic • UDP: VoIP-like stream of numbered and timestamped packets • TCP: VoIP-like constant data rate stream • TCP: Download-like maximum data rate stream • Log packet/data arrival time plus TTL at receiver • Also log transmit queue time and dequeue time • Logs retrieved to central repository for analysis and archiving
Jitter • Jitter is the variation in packet travel times and / or packet arrival times • Different definitions exist
Measurement of Jitter • E.g., beacon software transmits and receives synthesised UDP packets with sequence numbers and timestamps every 20 milliseconds (10,000 packets in one experiment) • 3 experiment runs per day • Compute jitter from timestamps logged
Packet Train Arrival Entropy • What is entropy? • Predictability of arrival timing • Recurring patterns in arrival timing • Provide example of entropy
Entropy Measures • Need to produce a string (or sequence of symbols) – think of this as a Shannon "source" • E.g., We have the following threshold • A = inter-arrival time 0- 15ms • B = inter-arrival time 15-18ms • C = inter-arrival time 18-22ms • D = inter-arrival time 22-25ms • E = inter-arrival time > 25ms • Then map inter-arrival times to symbols to get following results
Jitter to Entropy • Then: Compute entropy from string (Shannon, T-entropy, LZ compression ratio) • Entropy is able to classify more complex patterns as 'normal' that pure jitter measures would consider random • Example on previous slide maps to x = ECDEAC, If string contain all CCCCCC then jitters are normal since we transmit every 20 milliseconds. • "Real" strings are up to 9999 symbols long!
Beacons Long Term • Trends in jitter: Will jitter increase or decrease over time? • Trends in TTL: Will multipath propagation increase as additional links are added? • Trends in entropy: Will arriving data streams become less predictable? • Intend to measure for many years to come
Conclusions • Beacons provide tool for monitoring long term developments of jitter and entropy
Thank You Questions?