Download

1 / 11
110 likes | 234 Views
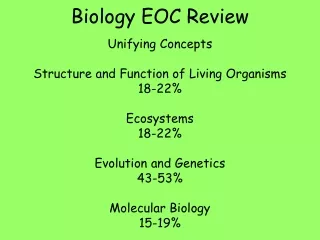
Taking the EOC BIOLOGY SOL TEST. TIPS and THINGS TO CONSIDER. Total Correct to make the mark!. Bottom level expectation. Mr. SMITH's All STAR's. Interpreting Charts and Images. You must look for patterns Identify what is being asked for

E N D
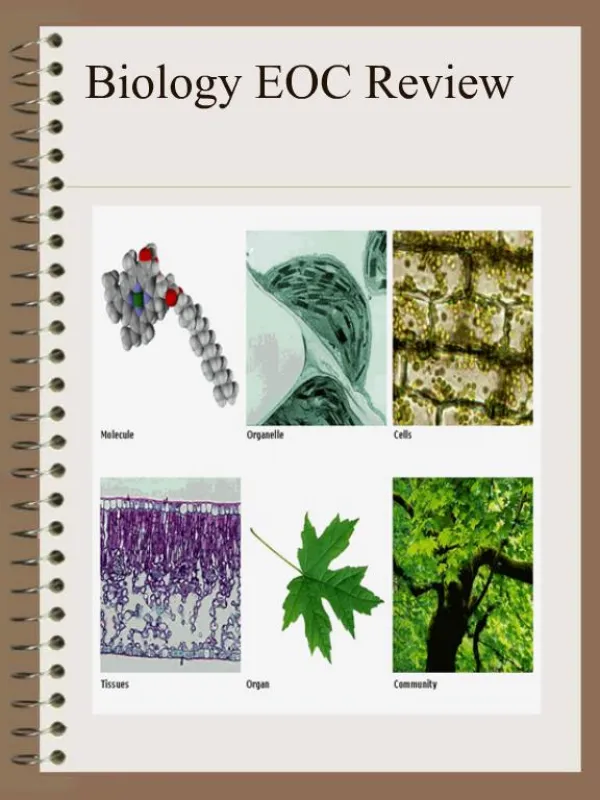
Taking the EOC BIOLOGY SOL TEST TIPS and THINGS TO CONSIDER
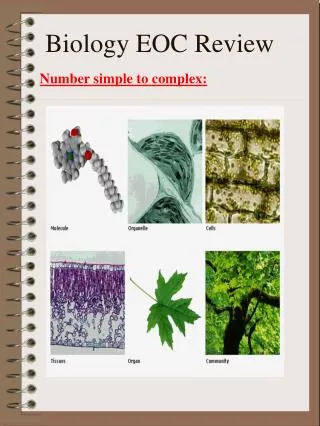
Total Correct to make the mark! Bottom level expectation Mr. SMITH's All STAR's
Interpreting Charts and Images • You must look for patterns • Identify what is being asked for • Use prior knowledge of scientific research on subject matter. • In the example there are two parents that contribute but only one’s DNA fingerprint is present for analysis. • Choose the best answer • The closest choice is the obvious selection to make.
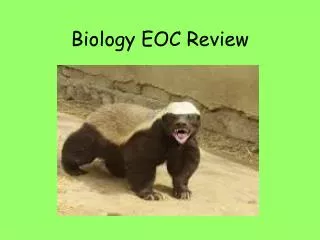
Interpreting Charts and Images • Comprehend the scientific key terms. • Herb is represnts of plant; vore is latin for eat. Apply common sense Meat eaters need many sharp teeth. Plant eaters don’t need that many sharp teeth to tear into it’s meal.
Interpreting Graphic Data • Y – axis is the measure of the variable tested • X – axis represents the variable being measured. • Look for peaks and declines represented by the lines or bars. • Look for key terms that indicate what the question implies such as maximize!
Interpreting Charts and Images • Identify terms • Best • Adapted • Picking up prey Beware of unnecessary information provided. Like measurements in the diagram provided. Size is not the issue accommodation is key here.
Interpreting Charts and Images • When analyzing images identify what you are looking for by reading the question thoroughly. • Scientific Method is applied here. • What is important for comparison when analyzing the effects of the IV on the DV. In the lab setup pictured above, a student is trying to determine the effect of pollutants on the growth of three groups of seeds. The results will not be valid because the experiment has no — A conclusion B hypothesis C control D variable
Interpreting Graphs • The Food Web is the required knowledge here. • If predator A decreases population B then population C in which B feed on will increase. This graph shows the sizes of lynx and hare populations between the years of 1845 and 1940. If a predator of the lynx enters the food chain, you might expect the number of — A lynx and hares to become equal B lynx to increase C hares to increase D hares and lynx to decrease
Charts • Understand the question then apply skills learned from genetics lessons. • Draw 3 Punnett Squares: They are necessary to simulate the chart data provided.
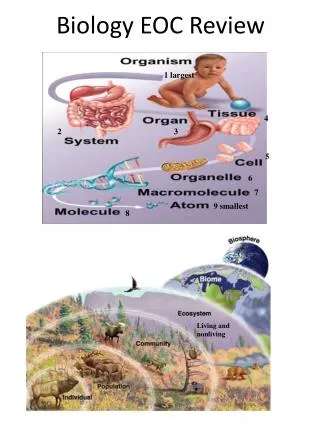
Images The implied knowledge here speciation, cell types and parts and terminology for cellular life forms. • The one-celled eukaryotic organisms above are often found in freshwater ponds. What is one characteristic they all have in common? • A Cilia • B Nucleus • C Pseudopodia • D Flagellum
Charts • Look for the obvious data in conclusive data charts. • The question asks about production of leaves. • The increase in number of leaves based on the manipulated variable gives away the answer.