Download
1 / 4
40 likes | 198 Views
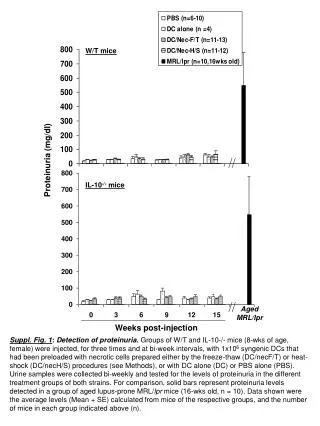
W/T mice. Proteinuria (mg/dl). IL-10 -/- mice. Aged MRL/lpr. Weeks post-injection.

E N D
W/T mice Proteinuria (mg/dl) IL-10-/- mice Aged MRL/lpr Weeks post-injection Suppl. Fig. 1: Detection of proteinuria. Groups of W/T and IL-10-/- mice (8-wks of age, female) were injected, for three times and at bi-week intervals, with 1x10⁶ syngenic DCs that had been preloaded with necrotic cells prepared either by the freeze-thaw (DC/necF/T) or heat-shock (DC/necH/S) procedures (see Methods), or with DC alone (DC) or PBS alone (PBS). Urine samples were collected bi-weekly and tested for the levels of proteinuria in the different treatment groups of both strains. For comparison, solid bars represent proteinuria levels detected in a group of aged lupus-prone MRL/lpr mice (16-wks old, n = 10). Data shown were the average levels (Mean + SE) calculated from mice of the respective groups, and the number of mice in each group indicated above (n).
W/T IL-10-/- Anti-dsDNA (IgG, AEU/ml) Anti-ssDNA (IgG, AEU/ml) Anti-chromatin (IgG, AEU/ml) Anti-histone (IgG, AEU/ml) Anti-SM//nRNP (IgG, AEU/ml) Weeks post-injection Suppl. Fig. 2:Serum autoantibody levels.Serum samples were taken from the mice described in Methods, at the indicated time points. Levels of 5 classical lupus-associated autoantibodies, i.e. anti-dsDNA, anti-ssDNA, anti-chromatin, anti-histone and anti-SM/nRNP, were quantified by ELISAs. Autoantibody levels against dsDNA and ssDNA were measured in all of the 4 treatment groups. Those against chromatin, histone and SM/RNP were measured selectively in the 2 main treatment groups (DC/necF/T, DC/necF/T) in comparison to those of DC alone control groups. Data shown are mean ± SEM calculated from individual mice of each group (n = 4-5). Arrows indicate the time of 3 injections given.
IgG1 (AEU/ml) Serum anti-dsDNA antibodies of different isotypes IgG2b (AEU/ml) IgG2c/IgG2ab (AEU/ml) Suppl. Fig. 3: Isotypic analysis of serum anti-dsDNA antibodies induced by DC/nec treatments. Serum samples taken 8-weeks after DC/nec treatments were assayed for the subclasses of anti-dsDNA antibodies in the circulation. Data shown are mean±SEM calculated from individual mice of each group (n = 4-5).N.D = not detected. Serum samples from the PBS-treated groups contained no or very low level of anti-DNA antibodies (total IgG), hence were not included in the isotypic analysis.
B A C D Suppl. Fig. 4: Characterization of the renal reactive autoantibodies in blood circulation.Frozen kidney sections prepared from normal C57BL/6 mice were used as the source of target autoantigens in this immunoreactivity assay. Serum samples taken from IL-10-/- mice treated with DC/necF/T (A), or DC/necH/S (B), and WT mice-treated with DC/necH/S (C) (8wks post 1st DC injection) were applied and incubated, followed by the FITC-conjugated goat anti-mouse IgG secondary antibody. Photomicrographs shown are results representative of 3 independent experiments. (D) Negative control: No serum (secondary antibody only).