Download
1 / 19
190 likes | 387 Views
Global patterns in lake ecosystem production and respiration. Chris Solomon Kevin Rose Denise Bruesewitz Dave Richardson Matt Van de Bogert …and many others. Lakes are net sources of CO 2 to atmosphere. Respiration > GPP. atmosphere. 0.8. 1.9. Terrestrial systems.

E N D
Global patterns in lake ecosystem production and respiration Chris Solomon Kevin Rose Denise Bruesewitz Dave Richardson Matt Van de Bogert …and many others
Lakes are net sources of CO2 to atmosphere Respiration > GPP atmosphere 0.8 1.9 Terrestrial systems Freshwater systems 0.9 ocean 0.2 storage Fluxes in Pg y-1; from Cole et al. 2007
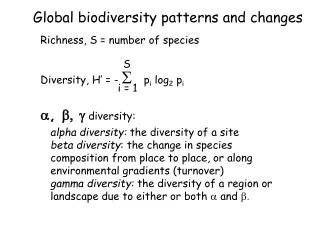
Why is R so variable in time? • How do temporal patterns in R differ among lakes? • What does within- and among-lake variability tell us about the drivers of R?
Why is R so variable in time? R = RAutotrophs + RHeterotrophs, autoch + RHeterotrophs, alloch Temperature GPP Terrestrial load
Data Dissolved Oxygen Jul Aug Sep Oct Nov ~25 lakes Strong gradients 3-12 months of data
Model GPP diffusive flux respiration DOt+1 = DOt + i*irrt + r + fluxt Fit this model to data for each day in each lake Example fits: Fredriksburg Slotso 2006
Respiration • Among lake • Seasonal • Daily Units are mg O2 L-1 d-1; lakes in order of increasing max(GPP)
Uncertainty in respiration estimates FredriksburgSlotso Feeagh Annie Crystal Bog Error bars give bootstrapped 95% CI
Temperature and GPP explain much of variation in R Three different models fit to the respiration data for each lake Full model: R ~ b0 + b1*e-b2/T + b3*GPP Temperature alone explains 27-81% of variation If you add GPP, can explain 37-94% of variation
Baseline R and GPP-driven R • “Baseline” R very similar in all lakes • Slope of relationship with GPP differs among lakes • Eutrophic lakes: low slope • Oligotrophic /dystrophic lakes: high slope • Need to fit model with common temperature parameters
Next steps • Gathering supplementary data • Some hypotheses / questions • Strength of R~GPP relationship depends on lake trophy • How do time scales of variation in R map on those of temperature, GPP? • What explains the other 60% of variation in R?
Model GPP diffusive flux respiration DOt +1 = DOt + GPPt - Rt + fluxt DOt+1 = DOt + i*irrt + r + fluxt fluxt = -kO2,t * (DOt - DOSatt) / zMixt * dummyt Estimate i, r by maximum likelihood (Odum, Hanson)
Terrestrial loads influence R~GPP relationship? 10% resource allochthony 50% resource allochthony So far… • Can only make weak test of this • No evidence to support hypothesis R GPP
Scales of variation in R Yuan Yang Annie Feeagh
Mean seasonal R and GPP Average seasonal epilimnetic chla: Our data ? del Giorgio and Peters 1993 (36 lakes for R) 0.5 to 5000 mg m-3