Download
1 / 47
470 likes | 588 Views
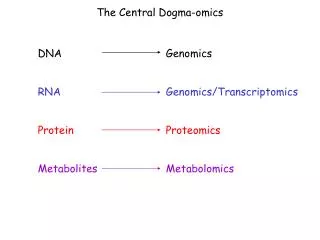
Comparative analysis of eukaryotic genes Mar Albà http://genomics.imim.es/evolgenome Barcelona Biomedical Research Park. Genome Projects. GOLD: Genomes Online Database (www.genomesonline.org). Genome Projects. GOLD: Genomes Online Database (www.genomesonline.org). Genome Projects.

E N D
Comparative analysis of eukaryotic genes Mar Albà http://genomics.imim.es/evolgenome Barcelona Biomedical Research Park
Genome Projects GOLD: Genomes Online Database (www.genomesonline.org)
Genome Projects GOLD: Genomes Online Database (www.genomesonline.org)
Genome Projects GOLD: Genomes Online Database (www.genomesonline.org)
Genome Browsers • NCBI Map Viewer • http://www.ncbi.nlm.nih.gov/mapview/ • Ensembl • http://www.ensembl.org • -UCSC Genome Browser • http://genome.cse.ucsc.edu The three databases use the same genome assembly, which is generated by NCBI.
Ensembl • genomic regions • alignments with synthenic sequences • genes • Homologs, SNPs • transcripts • EMBL mRNAS, ESTs, Expression • proteins • Gene Ontology (function), protein domains, disease • associations
Ensembl - Biomart - retrieval of information on gene datasets
coding promoter species 1 x N genes (orthologs) species 2 ... species m Gene comparative sequence analysis Genome and transcriptome projects have generated a vast amount of information on protein-coding and non-coding gene sequences. Identification of conserved sequences in different genes can help us understand gene evolution and identify functional regions.
Non-coding sequences in vertebrate genomes • only 1.2% of the human genome codes for proteins • but 5% exhibits high sequence conservation levels, • compatible with negative selection (MGSC, 2002) • non-coding • Transcription regulatory regions • Introns • Non-protein coding exons/genes (miRNAs, etc.) • Repetitive elements (Alus, etc.) • Ultra-conserved elements
Gene transcription regulatory sequences Maston et al., 2006 Annu. Rev. Genomics Hum. Genet. 7: 29-59
Frequently-found metazoan motifs in the core promoter Maston et al., 2006
Eukaryotic promoter diversity Wray et al. (2003), Mol. Biol. Evol. 20(9):1377-1419.
High evolvability of regulatory sequences • most of the changes in regulatory networks are likely to • occur in cis; changes in trans (transcription factors) may • often have too strong effects. • one single mutation may lead to the acquisition of a new • DNA-factor interaction (rapid turnover) • the expression in one tissue may evolve independently of • expression in another tissue (promoter modular organization) Wray et al. (2003) The Evolution of Transcriptional Regulation in Eukaryotes. Mol. Biol. Evol. 20(9):1377-1419.
Transcription factor binding sites (TFBS) are short and imprecise • short sequence motifs (6-12 bp) • some positions of the motif are variable • sometimes different transcription factors can recognize the same sequence motif TATAAA TATAGA TATAAA TATAAA GATAAA TATAAA TATAAA TATAAT *** TATA box
Transcription factor binding sites (TFBS) Weight matrices TATAAA TATAGA TATAAA TATAAA GATAAA TATAAA TATAAA TATAAT *** 1 2 3 4 5 6 - - - - - - - - - - - - A 0 8 0 8 7 7 C 0 0 0 0 0 0 G 1 0 0 0 1 0 T 7 0 8 0 0 1 -> can be used to search for putative motifs in sequences
Transcription factor binding site databases Place http://www.dna.affrc.go.jp/htdocs/PLACE/ TRANSFAC http://transfac.gbf.de/TRANSFAC/ http://www.biobase.de SCPD http://cgsigma.cshl.org/jian/ TRRD http://www.bionet.nsc.ru/trrd/ RegulonDB http://regulondb.ccg.unam.mx/ ooTFD / rTFD http://www.ifti.org/cgi-bin/ifti/ootfd.pl
TFBS prediction using weight matrices PROMO http://promo.lsi.upc.edu Farré, D., et al. (2003). Nucleic Acids Research 31: 1739-1748.
High false positive rate in TFBS prediction Test Sequences:200 vertebrate promoter sequences 607 experimentally-verified sites Predictions: Transfac v.6.4 SENSITIVITY: 46% SPECIFICITY: 2% Very low! Blanco, E., et al.. (2006). Nucleic Acids Research 34: D63-D67.
Comparative approaches are necessary Select those motifs or regions that are shared by: • orthologous sequences : phylogenetic footprinting • co-expressed genes : shared regulatory motifs
Phylogenetic footprinting Boffelli D, Nobrega MA, Rubin EM. (2004) Nat Rev Genet. 5:456-65
Phylogenetic footprinting Highly conserved enhancer in gene DACH1
Proximal promoter pre-initiation complex
Motif positional bias Signal Search Analysis Server (SIB)
proximal promoter regulatory module PIC TFB 2 TFBS 1 TFBS 1 TF1 TF2 ACT TSS Why some motifs should show positional bias? • promoter structure • protein-protein interaction positional constraints Predicted element Reference element (known)
PEAKS: identification of motif positional bias Predicted element Reference element (known) over-representation TFBS TSS functionally-related sequences (ex. co-expressed) random
PEAKS Step 1. Construct motif frequency profile sliding window 3 profile 2 2 1 1 1 1 seq1 seq2 seq3 seq4 Predicted element Reference element (known)
PEAKS Step 1. Construct motif frequency profile TSS 308 housekeeping genes Transfac v.6.4 matrix library
PEAKS Step 2. Measure significance of peaks For each matrix: maximum peak difference average signal +675 -325 CAAT-box Score (max peak) = Sa x Sb x Sc Sa = max peak / num motif Sb = max peak / num seq Sc = max peak / average num motifs
PEAKS Step 2. Measure significance of peaks • determine random expectation score cut-off for different levels of significance using 1000 random datasets • - define significant signal range: max peak cut-off 0.005 aver signal CAAT-box
PEAKS Step 3. Build “promoter type” NFkB TATA Sp1 BACH1 52 genes regulated by NFkB, p < 0.5%
PEAKS server http://genomics.imim.es/peaks/ Bellora, Farré and Albà (2007). Bioinformatics 23, 243-4.
PEAKS results human promoter sequences NFkB TATA TATA YY GC-box GC-box CAAT BACH1 52 NFkB regulated genes 308 housekeeping genes TRANSFAC vertebrate matrices
PEAKS results promoters from yeast genes, amino acid metabolism (86 genes) - 54 yeast weight matrices tested - significant regions detected by the method show significant enrichment in experimentally-validated sites
promoter species 1 species 2 promoter species 1 species 2 Measuring promoter sequence divergence Divergence (Non-aligned promoter fraction or dSM) 1. highly divergent -> less constraints 0.8 2. highly conserved -> more constraints 0.4 Castillo-Davis et al., 2004
0-0.1 0.1- 0.2- 0.3- 0.4- 0.5- 0.6- 0.7- 0.8- 0.9-1 1 0.2 0.3 0.4 0.5 0.6 0.7 0.8 0.9 Variability in promoter sequence divergence Average divergence = 70% 8385 human-mouse orthologues 2 Kb from transcription start site
Regulatory genes contain more conserved promoters than structural/metabolic genes Functional classes enriched in high score promoter alignments Lee et al. (2006). BMC Genomics 6: 188 - consistent with results by Iwama and Gojobori (2004)
Structural/metabolic genes contain less highly conserved promoters than regulatory genes Functional classes enriched in low score promoter alignments Lee et al. (2006). BMC Genomics 6: 188
Comparison neurogenesis versus ribosomal ribosomal neurogenesis Lee et al. (2006). BMC Genomics 6: 188
Is expression breadth related to promoter sequence divergence? orthologues human-mouse housekeeping tissue-specific intermediate Expression data from Zhang et al. (2004)
promoter species 1 species 2 Measure sequence divergence Divergence = non-aligned promoter fraction 2 Kb • tissue-specific • intermediate • housekeeping
Relationship between promoter divergence and expression breadth promoter divergence coding sequence divergence tissue-specific intermediate housekeeping Coding sequence evolutionary rate number of tissues but.. Promoter divergence
Relationship between promoter divergence and expression breadth % conservation TSS non-housekeeping housekeeping - divergence measured in 100 nt bins
Promoter divergence and gene function highly conserved promoter receptor binding signal transducer activity receptor activity structural molecule activity transcription regulator activity transcription factor activity DNA binding highly divergent promoter RNA binding ligase activity hydrolase activity catalytic activity GO class > 50 genes, p-value < 0.01
Promoter divergence and gene function divergence
Summary • the prediction of transcription factor binding sites • is very noisy, we need to use comparative genomics • some motifs show positional bias, this property can • help us understand the structure of promoters and improve motif predictions • promoter sequence conservation is related to gene function and to gene expression breadth. the fact that housekeeping genes contain less conserved promoters may obey to a more simple gene expression regulation
The team Evolutionary Genomics Group Universitat Pompeu Fabra, Barcelona http://genomics.imim.es/evolgenome Nicolas Bellora Domènec Farré Macarena Toll Medya Shikhagaie Loris Mularoni