Download
1 / 244
2.46k likes | 2.62k Views
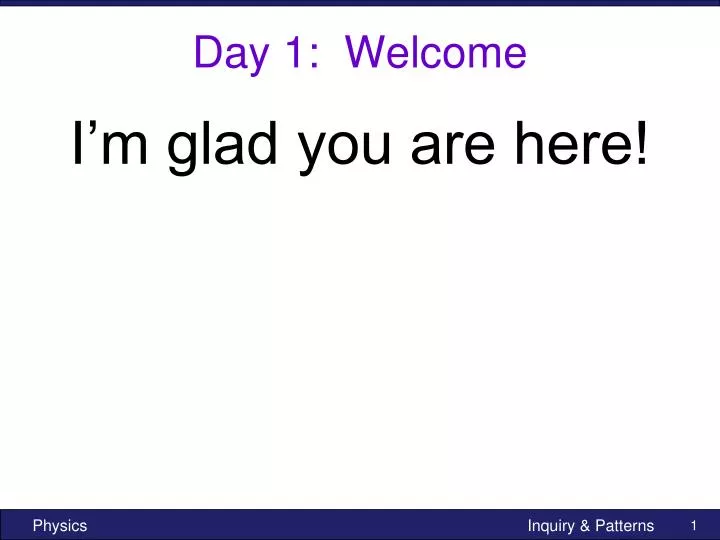
Day 1: Welcome. I’m glad you are here!. Course Outline. Need Parents Signature. Inquiry Cube (pg 3 pkt). What qualities do scientists have? What are scientists like? Draw what a scientist looks like. How do Scientists do their work? How would they describe a scientific investigation?.

E N D
Day 1: Welcome • I’m glad you are here!
Course Outline • Need Parents Signature
Inquiry Cube (pg 3 pkt) • What qualities do scientists have? What are scientists like? • Draw what a scientist looks like. • How do Scientists do their work? How would they describe a scientific investigation?
Front row: notice the blue circle on floor, • your desk will go back there after this… • Colored dot teams: front desks turn around to point desks head to head with back desks
Inquiry Cube • What are questions we can investigate about this cube? Do not touch, turn, lift, or move the cube in any way.
Inquiry Cube In your research team, determine: What’s on the bottom of the cube? Do not touch, turn, lift, or move the cube in any way. (Answer with evidence-based explanation)
What’s on the bottom of the cube? (evidence-based explanation): -Number sequence -opposite sides add to … (two different but related observations create a stronger argument!)
Inquiry Cube What is science? (How is it different than asking your best friend or looking something up on Wikipedia?)
Science is… (write the red!) Science originates in questions about the world.
Science is… Science originates in questions about the world. Science uses observations to construct explanations (answers to the questions). The more observations you had that support your proposed explanation, the stronger your explanation, even if you could not absolutely confirm the answer by examining the bottom of the cube.
Science is… Science originates in questions about the world. Science uses observations to construct explanations (answers to the questions). The more observations you had that support your proposed explanation, the stronger your explanation, even if you could not absolutely confirm the answer by examining the bottom of the cube. Scientist make their explanations public through presentations at professional meetings and journals.
Science is… Science originates in questions about the world. Science uses observations to construct explanations (answers to the questions). The more observations you had that support your proposed explanation, the stronger your explanation, even if you could not absolutely confirm the answer by examining the bottom of the cube. Scientist make their explanations public through presentations at professional meetings and journals. Scientists present their explanations and critique the explanations proposed by other scientists.
Science is… Science originates in questions about the world. Science uses observations to construct explanations (answers to the questions). The more observations you had that support your proposed explanation, the stronger your explanation, even if you could not absolutely confirm the answer by examining the bottom of the cube. Scientist make their explanations public through presentations at professional meetings and journals. and critique the explanations proposed by other scientists.
Science is… finding and using patterns in nature to predict the future or understand the past. (Now write!)
Inquiry Cube #2 • In your research groups for the second investigation: Do not touch, turn, lift, or move the cube in any way.
Inquiry Cube Low Medium High • First Hypothesis: (just guess) confidence: • Data • (pg 4 pkt): • 8. Patterns: a. b. c. • (Research groups plan to publicly share your findings and evidence)
Inquiry Cube • Research groups publicly share your findings and evidence. • 9. What is the benefit to hearing other research groups’ ideas? • … gain further understanding!
Inquiry Cube • Scientists use patterns in data to make predictions and then design an experiment to assess the accuracy of their prediction. This process can also produce additional data. • 10. Use your observations (data) to make a prediction of the number in the upper-right corner of the bottom.
Inquiry Cube What is another test we could perform to determine with even more confidence (less error) what is on the bottom?
Inquiry Cube • With your limited funding you are able to purchase a small amount of technology and other equipment in order to test your prediction… • … mirror and probe: decide which corner to inspect, and why, • then inspect (only the corner!), and make your final hypothesis.
Inquiry Cube • 11. Final Hypothesis confidence: Low Medium High
Inquiry Cube Finally… YOU MAY LOOK AT THE BOTTOM!
Inquiry Cubetake 2 minutes to write… • *12. Describe how your confidence changed from first hypothesis to final hypothesis and why? • *13. How is this activity like real science? • *14. What about science doesn’t this activity capture?
Checking in (pg 3 science is) : Science originates in questions about the world. Science uses observations to construct explanations (answers to the questions). The more observations you had that support your proposed explanation, the stronger your explanation, even if you could not absolutely confirm the answer by examining the bottom of the cube. Scientist make their explanations public through presentations at professional meetings and journals. and critique the explanations proposed by other scientists.
Student Questionnaire • Please be thoughtful. Your HW: course outline (read/sign with home folks) Student Questionnaire Finish Inquiry Cube
Agenda Asking Good Questions Average & Uncertainty Accuracy & Precision Due Tomorrow Inquiry Skills & Data Sets Practice (pg 5 and 6) Day 2: take out: packet, spiral, calculator, signed paper, Student Questionnaire Opening Question: What makes for a good science question? • Upcoming Events • Spring Experiment Due Today Inq cube, signed papers, student questionnaire
Good Science Questions • Can be answered with observable data. • Leads to explanations about how the world works. • Allow us to predict the future • or understand the past.
Debrief Inquiry Cube: • Discuss with teammates: pg 4, #12, 13, 14 • (I’ll come check your work on pg 4…)
Checking in (pg 3 science is) : Science originates in questions about the world. Science uses observations to construct explanations (answers to the questions). The more observations you had that support your proposed explanation, the stronger your explanation, even if you could not absolutely confirm the answer by examining the bottom of the cube. Scientist make their explanations public through presentations at professional meetings and journals. and critique the explanations proposed by other scientists.
From Questions to Making Measurements & Collecting Data • Once you have a focused science question you need to know how to make measurements and collect data to inform yourself about how nature works. • You need an independent variable (manipulated variable): the one you change. • Then a dependent variable: the one you think will change as a result of the independent variable. • Then control as best as possible all other things that might change the dependent variable.
Experimental Basics • Independent Variable: We change it • Dependent Variable: is changed by Independent variable • Controlled Variables: everything else that may effect the experiment • Practice: You observe that when you drop you textbook it makes a loud sound on impact with the floor.
Example (discuss with team) • You notice a book dropped from different heights creates a sound of different intensity. So you ask “How does the height of the book affect the intensity of sound when it hits the ground?”. • The independent variable(we change it):_____________ • The dependent variable(depends on the IV): ____________ • What are the controlled variables:
Review pg 5… • "How does the breaking strength a column of cement depend on its diameter?" • 10. What is the independent variable__________ • 11. What is the dependent variable? __________ • 12. What are the controlled variables? (i.e. what must you keep constant?)
Break… turn in student questionnaire • Who is Schilling?
Wild guess: How tall am I? • How certain are you of that estimate? • All measurements have some degree of UNCERTAINTY: • 6 ft +- .5 ft
Which has more UNCERTAINTY: • 6 +- 1 ft Or 6.000 +- .005 ft More “precise” Less uncertainty Larger uncertainty
Our goal when making measurements: • Good PRECISION and good ACCURACY • PRECISION: make detailed measurements • 6.05 ft is more precise than • 6 ft • using finely-calibrated tools
ACCURACY: how close to the true value a measurement is 6 ft is more accurate for my height than 12.335 ft (I’m 5.95 ft tall ) using calibrated tools
Data: range and uncertainty • What is the same about these data sets? • What is different about these data sets? • Set A: 19, 15, 17 = length of a shoe • Set B: 17, 23, 11 = length of same shoe • Which sets seems better? Why? • How can we visually communicate this?
DataYour Science is only as Good as your Data • Summarize this 2 data sets? How do we communicate one seems better than the other. • Set A: 19, 15, 17 • Set B: 17, 23, 11 Average 17 17 Average Uncertainty 17 +/- 2 17 +/- 6 Range Put in toolbox Uncertainty in Average = 2 Range = biggest number – smallest number
DataYour Science is only as Good as your Data • Summarize this 2 data sets? How do we communicate one seems better than the other. • Set C: 20, 20, 17 Average Uncertainty 19 +/- 2 Range Put in toolbox Uncertainty in Average = 2 Range = biggest number – smallest number
Science is Data DrivenYour Science is only as Good as your Data • Summarize this 2 data sets? How do we communicate one seems better than the other. • Set D: 4.5, 4.6, 4.4 • Set E: 112,121,117 Average Uncertainty 4.5 +/- 0.1 116.6666 +/- 5 Something weird here? Range Put in toolbox Uncertainty in Average = 2 Range = biggest number – smallest number
Science is Data DrivenYour Science is only as Good as your Data • Important practice: • Set F: 6, 8, 9 Put in toolbox Rule of thumb: uncertainty has only 1 significant figure So we have a 5-step process: 1- Find the math Average 2- Find the range 3- Find the rough uncertainty, by dividing the range by 2 4- Round rough uncertainty to 1 significant figure 5. Match the decimal place of average to that of the uncertainty Average Uncertainty 7.6666 +/- Range = 9 - 6 = 3 1.5 2 8
Try it yourself with 5-step process: 1- Find the math Average 2- Find the range 3- Find the rough uncertainty, by dividing the range by 2 4- Round rough uncertainty to 1 significant figure 5. Match the decimal place of average to that of the uncertainty • Set G: 423,487,461 Average Uncertainty 457 +/- Range = 487-423 = 64 460 32 30