Download
1 / 29
290 likes | 458 Views
Air quality communication in Shanghai. Shanghai Environmental Monitoring Center Feb 12 th , 2014. —— AirNow -I system and application. Outline. I Background II Introduction of AirNow-I system III Air quality information release in Shanghai IV Future prospect.

E N D
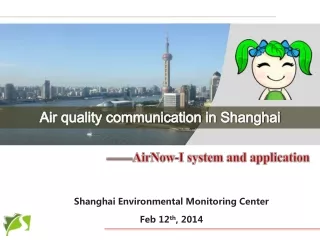
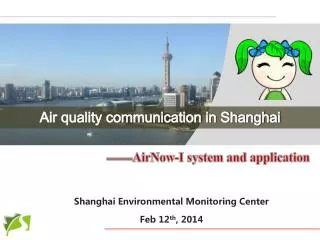
Air quality communication in Shanghai Shanghai Environmental Monitoring Center Feb 12th, 2014 ——AirNow-I system and application
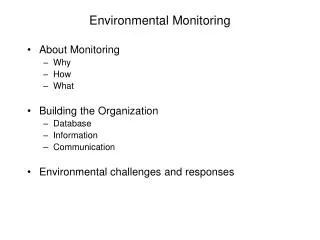
Outline I Background II Introduction of AirNow-I system III Air quality information release in Shanghai IV Future prospect
AIRNow-I Cooperation • On April 17, 2008, Mr. Zhang Quan, Director of Shanghai Environmental Protection Bureau (SEPB), and Ms. Elizabeth Craig, EPA’s Assistant Administrator, signed an official cooperative agreement to develop AIRNow-International (AIRNow-I)’s pilot in Shanghai.
AIRNow-I Cooperation • Since 2008, U.S. and Chinese scientists and experts have collaborated to build AIRNow-I core infrastructure. • 50 conference call,900 email messages,80 days of training,800 person-day of development time
Outline I Background II Introduction of AirNow-I system III Air quality information release in Shanghai IV Future prospect
Framework of AirNow-I Air quality forecasting subsystem Daily report operation and publishing subsystem DMS Ingest/import data QC automatically QC manually Calculate data Generate reports IMS Mapper Dispatcher Info services Meteorological info download Daily report operation platform Numerical forecasting interface Information release system Ensemble Model System Data import and integration subsystem
AIRNow-Shanghai Fuction of AirNow-I Air Quality Real-time Notification 2010Shanghai Expo YRD Regional Cooperation Information Release Air Quality Forecasting Manual/Automatic Monitoring QA/QC AIRNow-I Forecasting Aiding Tools Meteorological Data Download Data Process Daily Report Mapping (Concentration Distribution)
AIRNow-I – DMS Data Management System (DMS) • Ingest/import data • QC automatically • QC manually • Generate reports
AIRNow-I – IMS • Information Management System(IMS) • Convert data to products • Create maps • Create files
IMS products China YRD Shanghai
Meteorological Data Download • More than 100 kinds of meteorological information • Automatic downloading
Outline I Background II Introduction of AirNow-I system IIIAir quality information release in Shanghai IV Future prospect
Transition Beginning 2011 API Forecast by period 2012 AQIReal-time Release 2013 AQI Forecast by period Milestone • 1997 • Air Quality Weekly Report • 1998 • Air Quality Daily Report • 1999 • 24-hour Forecast Development • 2009 • 48-hour Forecast • Heavy Pollution Nowcasting • 2010 • Real-time Information Release • 2005 • Weekly Estimated Forecast • District-scale Daily Report History of air quality info release in SH
EXPO air quality website • Air Quality in Expo Park • Daily Report of Expo • Hourly Air Quality Information Release • Air Quality of Shanghai • Daily Report in Shanghai • Forecasting • Divided by District • Concentration Distribution Map of Particulates • Air Quality in YRD • Daily Report in YRD
YRD data platform • 3 Provinces • 9 Cities • 8 Pollutants • 54 Stations
Real-time Website Government Website Air quality data system Weibo Cell Phone iPhone Android Radio TV Public approach Update every hour Update every hour Update four times every day Update every hour Update twice every day in prime time of morning and evening
Outline I Background II Introduction of AirNow-I system III Air quality information release in Shanghai IV Future prospect
More Air Quality Data • Add new PM2.5 monitoring stations in Suburban Areas • District-scale air quality information release
Regional air quality forecasting system in YRD Data Transfer Combined Monitoring and Assessment Monitoring Data Regional Air Quality Forecasting System in Yangtze River Delta Region Forecasting Products AQI Visibility O3 Super -station PM2.5 Visual Aids in Discussion United Heavy Pollution Alarm Team Building Combined Air Quality Forecasting System Operational Forecast Combined Emission Inventory United Forecasting Models SHANGHAI JIANGSU ZHEJIANG