Download

1 / 10
100 likes | 208 Views
SPI GCDE Survey Line Simulations A. Strong December 2001. GCDE 1 st year : 2 cycles = 4.2 10 6 sec Simulations using ISDC OSIM+SPI issw os_pdefgen define pointings gensky model sky spisimprep prepare deadtime etc

E N D
SPI GCDE Survey Line Simulations A. Strong December 2001
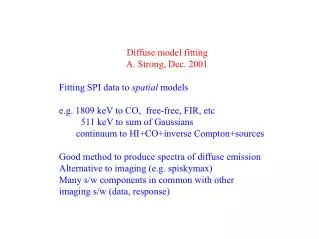
GCDE 1st year : 2 cycles = 4.2 106 sec Simulations using ISDC OSIM+SPI issw os_pdefgen define pointings gensky model sky spisimprep prepare deadtime etc spiback background model spiskycnv simulate data spiskymax imaging analysis Studies of continuum done previously, here concentrate on lines.
GCDE 1st year : 2 cycles 4.2 106 sec gcde.18 511 keV line singles only model based on Kinzer et al. (2001); background: P. Jean model spiskymax image
GCDE 1st year : 2 cycles 4.2 106 sec gcde.16 1809 keV line, 2.4 keV FWHM 3 keV bins singles only model based on 240mm emission, scaled to COMPTEL map. Background: P.Jean spiskymax image model Line 1807.5-1810.5 keV 1804.5-1807.5, 1810.5-1813.5
GCDE 1st year : 2 cycles 4.2 106 sec gcde.19 1809 keV line, 2.4 keV FWHM. 2 keV bins singles only model based on 240mm emission, scaled to COMPTEL map. Background: P.Jean spiskymax image model Line 1808-1810 keV 1804-6-8, 1810-12-14
GCDE 5 years : 10 cycles 21 106 sec gcde.20 1809 keV line, 2.4 keV FWHM. 2 keV bins singles only model based on 240mm emission, scaled to COMPTEL map. Background: P.Jean spiskymax image model Line 1808-1810 keV 1804-6-8, 1810-12-14
1809 keV 2.4 FWHM 240mm model scaled to COMPTEL maps spidiffit, singles only GCDE 1 year GCDE 5 years gcde.20 gcde.19
Commissioning phase = 0.9 Ms staring+3*0.27 Ms 5X5 +0.2 hex Ms 1809 keV 2.4 keV FWHM 240mm model spidiffit Model spiskymax pointings Exposure insufficient to generate significant map, but line can be detected at 4s using model fitting spidiffit
Commissioning phase = 0.9 Ms staring+3*0.27 Ms 5X5 +0.2 hex Ms 1809 keV 2.4 keV FWHM 240mm model spidiffit Model pointings Exposure insufficient to generate significant map, but line can be detected at 4s using model fitting spidiffit
Next steps consider combining GCDE with GPS & open time data these will increase 1st year data by factor 5 over GCDE (although not concentrated in same region)