Download
1 / 46
480 likes | 718 Views
Modeling the Default Risk of Unlisted Firms. www.kmv.com (020)7778 7400. London GARP November 14, 2001. Stephen Kealhofer Brian Dvorak. Background. First model for listed firms 1989 Analyzing the Z-score models First model for unlisted firms 1993. What we discovered.

E N D
Modeling the Default Risk of Unlisted Firms www.kmv.com (020)7778 7400 London GARP November 14, 2001 Stephen Kealhofer Brian Dvorak 1
Background • First model for listed firms 1989 • Analyzing the Z-score models • First model for unlisted firms 1993 2
What we discovered • Information content of the accounting variables • book leverage • volatility • value • Statistical methodology • Quality of actual accounting data • Problem of reverse causation 3
What we did • Reverse causation: • New class of model • Statistically determine the inputs to a structural model of default • More data / isolate key causal variables • Quality of accounting data: • Minimize usage / focus on more robust data • Information content: • Look to traded markets to improve information 4
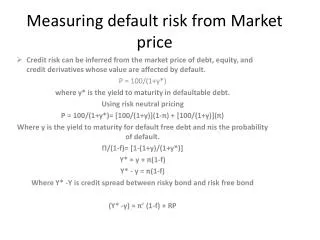
Testing • What to test? • Default prediction • Correlation with secondary market values for credit instruments • Need to test against target populations • Benchmark against feasible alternatives on same population 5
Result • Ongoing • Data is still primitive in many markets so we are still learning • Third major version • Transportable • Current • Analytic • Transparent 6
Market-Based Models Allow Global Application The market-based approach doesn’t need to be re-fit or calibrated to each country. Instead it uses the information imbedded in local market data. 8
Cause and Effect Model A firm defaults because the value of its business falls below its liabilities due. Asset Volatility This firm defaulted after several years of difficulty in its construction materials sector. The market asset value reflected the firm’s negative prospects. Market Asset Value Book Liabilities 9
Cause and Effect Model A firm defaults because the value of its business falls below its liabilities due. Book accounting figures often give misleading signals on the value of the business Market Asset Value Book Assets How can we get market signals about asset value for private firms? Book Liabilities 10
Two Major Modeling Approaches • Although there are many models to characterize credit risk, they fall into two categories: • Statistically fitted models • Market-based models Fitted models use the relationships found in historical accounting data predict credit events. Market-based models add market data on the industry and country to anticipate credit events. In this presentation, we examine how the market based approach helps us understand credit risk, particularly for turning points in the credit cycle – like today. 11
Three Measures of the UK Credit Cycle Median UK BBB Corp Spread Median UK PFM EDF Median UK Z-Score (inverted so up is greater risk) In the UK, Private firm EDFs and Corporate Bond spreads indicate that we have headed into the trough of the credit cycle. Scores based solely on fitting to accounting data do not yet show the deterioration because of the lagging nature of financial statements. 12
Market vs Fitted Models You can improve the use of the data in the fitted model from the Z-score model through more sophisticated econometrics. Ultimately, however, linear regression, non-linear fitting techniques, neural nets or other econometrics can only extract the signal inherent in the data. That signal can only be refreshed at the frequency that the statement data arrives – quarterly at the very best, annually in most cases. Hence the consistent lag we see relative to the market based signals above. 13
Extracting Market Data:Cause & Effect Model • 3 Drivers • Market Value of Assets (Business value) • Asset Volatility (Business risk) • Default Point (Liabilities due) 14
Asset Value for the Private Firm • The value of a business, public or private, is driven by its ability to generate future cash flows • In most times, historical statements provide some modest insight into future cash flows • At turning points in the sector or the economy, historical statements provide no information After September 11th, what insight can a model gain from historical financial statements for airlines? Hotels? Retailers? Where is the signal about 2002 in trailing ROA, book equity, or last year’s inventory-to-cost of goods sold? 15
Asset Value for the Private Firm • When there is no equity market price on that specific firm to signal its future cash flows, • KMV uses the firm’s own current financial statement, with trailing 12-month figures plus • The equity market’s view on future cash flow prospects in that sector Key reason for the model’s predictive power 16
Getting Market Asset Values • The equity market’s view on future cash flow prospects in that sector KMV gets market asset values for public companies by using an options approach, the Vasicek/Kealhofer model. This model allows us to back out implied underlying asset values from market equity prices. 17
Standard Options Terms Call Option Value = Market Value of Equity KMV Approach (Vasicek/ Kealhofer Model) Strike Price = Book Liabilities Implies Implied Underlying Asset Value Market Value of Assets Getting Market Asset Values • Equity derives its value from the cash flows of the firm. • Equity is a call option on the firm’s assets: the right, but not the obligation, to “buy” the firm’s assets from the lender by re-paying the debt. For a complete description of the approach, see Modeling Default Risk, available on www.kmv.com 18
Market Data Signals When Changing Cash Flow Prospects in a Sector Each month we observe the market value of assets for a universe of publicly traded firms in 61 distinct industries Each square is a public firm in the same sector – the comparables. The Private Firm Model uses the relationship between trailing EBITDA & market asset value Market Asset Value EBITDA 19
Q2 1998 -- Collapse in oil prices leads the market to “haircut” the asset values of comparables Market Data Signals When Changing Cash Flow Prospects in a Sector Each month we observe the market value of assets for a universe of publicly traded firms in 61 distinct industries Market Asset Value EBITDA 20
Market Data Signals When Changing Cash Flow Prospects in a Sector Oil & Gas E&P Defaults & Bankruptcies 1980-1999 The market signaled this credit event: the 1998 collapse of oil prices triggered defaults in 1999, to a level not seen since the mid-eighties oil price collapse. 21
Q1 1999 -- Market strongly signals the recovery in global oil prices Market Data Also Signals Improvement Asset values on comparables rise in anticipation of improving cash flows – an early “opportunity signal” Market Asset Value EBITDA 22
Market Data Signals When Changing Cash Flow Prospects in a Sector Oil & Gas E&P Defaults & Bankruptcies 1980-2000 23
Dynamic Market-Driven Measures are Critical for Industries Experiencing Turning Points After September 11th, are trailing 12-month accounting figures useful in characterizing risk for the next year in impacted industries? What does historical data tell you about telecoms today when the sector has moved from stable monopolies to dynamic competition? 24
# of Firms An Industry in “Transition”: Huge Growth in Telecom Firms Globally Globally, the number of publicly traded firms in the sector grew by 60% over 5 years. What fueled that? 25
Total Liabilities An Industry in “Transition”: Huge Growth in Telecom Liabilities Lending! Total liabilities in the sector tripled. 26
# of Firms Telecom: Significantly Changing Population Most of the growth came from smaller firms. All Firms Smaller & Medium Telecoms (Under $1B US in Book Assets) Large Telecoms ($1B US or over in Book Assets) 27
# of Firms An Industry in “Transition”: Telecom Defaults Globally, the number of defaults in KMV’s default database in the sector has exploded. And the type of firms defaulting is different Covad, Atlantic Telecom Group PLC, … People’s Telephone Company, 1995 28
Telecom: Measuring Business Risk Business risk is critical for understanding credit risk. How predictable are the firm’s earnings? KMV measures this as Asset Volatility 28% Ann. Volatility Marconi Asset Value 14% Ann. Volatility British Energy Asset Value Marconi has more difficult earnings to predict than British Energy, so the market re-values Marconi frequently. Asset volatility is highly reflective of country, size & industry and can be inferred from comparables for private firms. 29
Asset Volatility (Ann % Std Dev) Telecom: Significantly Changing Business Risk Telecom business risk is up at every size range. Under $1B US in Book Assets Asset volatility is highly related to company size (and industry!) $1B or over US in Book Assets 30
Modeling Implications of a Changing Sector Telecom business risk is up at every size range – earnings in the sector are less predictable The composition of the population has changed towards smaller more volatile companies As a result, the sector has less debt capacity relative to observed earnings Historically fitted relationships for firms in the sector will biased, and must be used with caution or refit. Market data can be refreshed monthly to pick up such changing conditions 31
UK private firmsDefaults: Graydon UK / Population:Bureau van Dijk (Jordans) 76% Percent of defaults excluded PFM EDF credit measure Z-Score Benchmark Model Percentage of population excluded Median EDF corresponding to percentile 32
- 76% of the defaults will be excluded if we exclude 30% of the population that has the highest EDFs - This means, 682 defaults will be excluded of the 901 defaults - The median EDF for the 30th percentile is 5,32 (approximately a B rated company) UK private firmsGraydon UK/BvD Data Period covered: 1994-2001 Number of companies, sample data: 31441 Number of companies, 1998: 23186 Number of statements, sample data: 182777 Number of observations, sample data: 1668610 S&P Rating CCC B BB BBB A AA AAA When we use PFM to discriminate credit quality: 33
Two Modeling Approaches The market-based approach has proven very powerful. It gives distinct signals that lead fitted models, because it powers the same company financial statement information with market insight on the firm’s industry and country. Market data becomes even more critical as banks move risk via market mechanisms. The market’s pricing will reflect dynamic credit quality – matching that up with historically oriented risk data can create distortions. 34
Appendix I: Using the Structural Approach to Analyze Changes in Risk – A Private Telecom Example 35
Using the Structural Approach to Analyze Changes in Risk • For any firm – public or private, the use of a structural model allows the analyst to • View which of the 3 drivers created the change in risk • Sensitivity-test each driver • Directly pro-forma the impact of new transactions 36
Using the Structural Approach to Analyze Changes in Risk Since June 1998, a 5-fold increase in default risk. What drove that? 37
Using the Structural Approach to Analyze Changes in Risk: EDF Drivers Let’s examine the asset value drivers: EBITDA & sector market signal Market Leverage declined, then rose for this private firm. Market Asset Value Liabilities & Default Point 38
EBITDA holding flat but prospects in sector down significantly Growing EBITDA & positive market signal on telecoms indicate greater asset value Using the Structural Approach to Analyze Changes in Risk: Asset Value Drivers Firm-specific EBITDA Comparables Market Asset Value Liabilities & Default Point 39
Using the Structural Approach to Analyze Changes in Risk Market Asset Value Why did EDF rise in 98 & 99 when asset value was rising? Liabilities 40
Using the Structural Approach to Analyze Changes in Risk Why did EDF rise in 98 & 99? Business risk or asset volatility was up significantly. Comparables Asset Value Comparables Volatility 41
Using the Structural Approach to Analyze Changes in Risk EBITDA Z-Score (inverted, up is increasing risk PFM EDF Today - -the rising EDF indicates market signal on future earnings, not yet seen in the lagged statement. The improvement in the fitted score is driven by the firm’s positive EBITDA performance. The market signals on the sector anticipated some of the positive impact 42
Using the Structural Approach to Analyze Changes in Risk We could continue the analysis by examining this firm relative to public and private telecom companies, other UK firms or other BB-type risks. The analyst might drill down and examine which firms were used as public comparables, and apply his own criteria to selecting an appropriate universe for comparison. 43
Using the Structural Approach to Analyze Changes in Risk Banks are constantly considering new liabilities –the ability to pro-forma the post-transaction risk (under a number of structuring alternatives) is critical. Because the user can re-run the structural model and examine the input, seeing the direct impact, the model becomes a transparent starting point for objective analysis. 44
Appendix II: Other Country Testing Notes on testing: the Private Firm Model is not fitted on private firms, or public, for that matter. The insight the model has on German private firms, UK, etc… comes from market data on the industry and country, coupled with the firm’s own statement information on leverage and cash flow. Because of this, the testing is completely out of sample. While results will vary in the power curves from sample to sample, we can confidently expect similar power even as new firms come into the population, as the European countries become more integrated, as accounting methods change or as dramatic events reverse the prospects of whole countries or sectors. 45
German Private FirmsDeutsche Bundesbank co-project Percent of defaults excluded Percentage of population excluded Median EDF corresponding to percentile 46