Download
1 / 30
300 likes | 322 Views
Explore the shift in the U.S. economy towards global trade, with insights on supply chains, trade values, and workforce effects from 1986 to 2016. Understand how the U.S. contributes to imports, exports, and production, and the impact on companies, consumers, and workers. Uncover perspectives on foreign trade, involvement in the global economy, and the divisive opinions on tariffs and free trade agreements among Americans. Dive into data on U.S. real manufacturing output, employment trends, and public views on global trade dynamics.

E N D
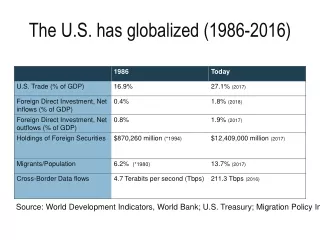
The U.S. has globalized (1986-2016) Source: World Development Indicators, World Bank; U.S. Treasury; Migration Policy Institute; McKinsey & Co.
THE NUMBERS: World container capacity - * "Twenty-foot equivalent units“ ** As of November 2, 2017
Trade Has Become a Larger Part of the U.S. Economy Percentage Share of GDP • Trade, as a share of U.S. gross domestic product, has increased from 20 percent in 1992 to over 27.1 percent in 2018. (World Bank) 3
Currency trading is the world's largest market. THE NUMBERS: * Goods and services combined. Source: World Bank And a table, with all figures for 2017: * 2016 Data from BIS ** All coinage and banknotes, per The Money Project. All other Data from World Bank, IMF, or Bank for International Settlements
Global Supply Chains Sources of value in a specific product Germany iPhone: $179.00 Assembly: $6.50 $30.15 Korea Retail price: $500.00 China USA $22.96 Japan $60.60 Components: $10.75 Rest of world $48.04 Source: Xing and Detert, 2010 • Although the iPhone says “made in China”, only a small amount ($6.50) of the $179 value of each iPhone exported to the US is added in Chinese assembly. • The United States adds $10.75 of value in components to each phone—more than China! • Apple and other U.S. retailers capture substantial value ($321)
Share of the global economy in purchasing power parity terms% of global GDP, PPP basis Note: These data apply Maddison’s long-term growth projections to his historical PPP-based estimates for 29 OECD member countries and 129 non-member economies. Source: Authors’ calculations based on Maddison (2007) and Maddison (2010)
Global supply chains:Sources of value in U.S. goods and services Note: U.S. absorption refers to total use by U.S. consumers , companies, and government. Key facts on U.S. imports, exports, and production • Imports: • The US contributes more value to U.S. imports (8.3%) than does China (7.7%) (U.S. components are sent abroad and U.S. value returns in finished goods) • The Americas, Asia, and Europe are all important sources of value • Absorption: (total use by U.S. consumers, companies, and government) • 89.0% of the value of goods and services used in the U.S. is generated in U.S. • But for some industries, the U.S. contribution is much lower: The U.S. adds only one-third of the value of electronics it uses • Exports: The U.S. contributes 87.1% of the total value in U.S. exports 12
Global supply chains:Effects of U.S. participation • Effects on U.S. companies • Companies achieve increased productivity, lower costs • Success often requires focus on coordinating tasks of other firms in chain • Effects on U.S. consumers • Consumers gain: Lower prices, faster access to goods • Effects on U.S. workers • Higher-skilled workers likely benefit • The effect on lower-skilled workers is ambiguous • The technology of modern logistics improves productivity, but these workers compete with lower-wage workers abroad. • Workers performing routine tasks most at risk • No consensus on overall effect on workers • Several studies suggest small but positive effect 13
U.S. wages have stagnated even as productivity and national income per capita have grown Source: Economic Research, Federal Reserve Bank of St. Louis
U.S. Real Manufacturing Output vs. Employment 1987 to 2016
Americans See Foreign Trade as an Opportunity Not a Threat 2017
And a Plurality Say Free Trade Has Helped Their Financial Situation
But Americans Are Split on the Value of Involvement in the Global Economy When Reminded of the Costs Which statement comes closer to your view about U.S. involvement in the global economy? Source: Pew Research Center Survey, April 12-19, 2016.
And Trade Has Never Been a Priority for Most Americans, Although They Are Slightly More Concerned in 2017 Rating each a top priority for the president and Congress *Before 2014, question asked about ‘illegal immigration.’+Prior to 2016, question asked about ‘global warming.’ Source: Pew Research Center survey, conducted Jan. 4-9, 2017. www.pewresearch.org
A Sharp Partisan Divide Existed in 2018 on the issue of increasing Tariffs
Young People and Hispanics Most Supportive of FTAs Free trade agreements between the U.S. and other countries have been a good thing for the United States • Note: Whites and blacks include only those who are not Hispanic; Hispanics are of any race. • Source: Pew Research Center Survey, August 9-16, 2016. www.pewresearch.org
Why?: Americans Believe Outsourcing and Imports Posethe Greatest Harm to U.S. Workers Overall, do you think __ has done more to help or hurt American workers? • Source: Pew Research Center Survey conducted May 25-June 29, 2016.
And Few Think Free Trade Deals Boost Jobs www.pewresearch.org