
Improved Tropical Cyclone Intensity Estimation Using Satellite Imagery and Algorithms
E N D
Presentation Transcript
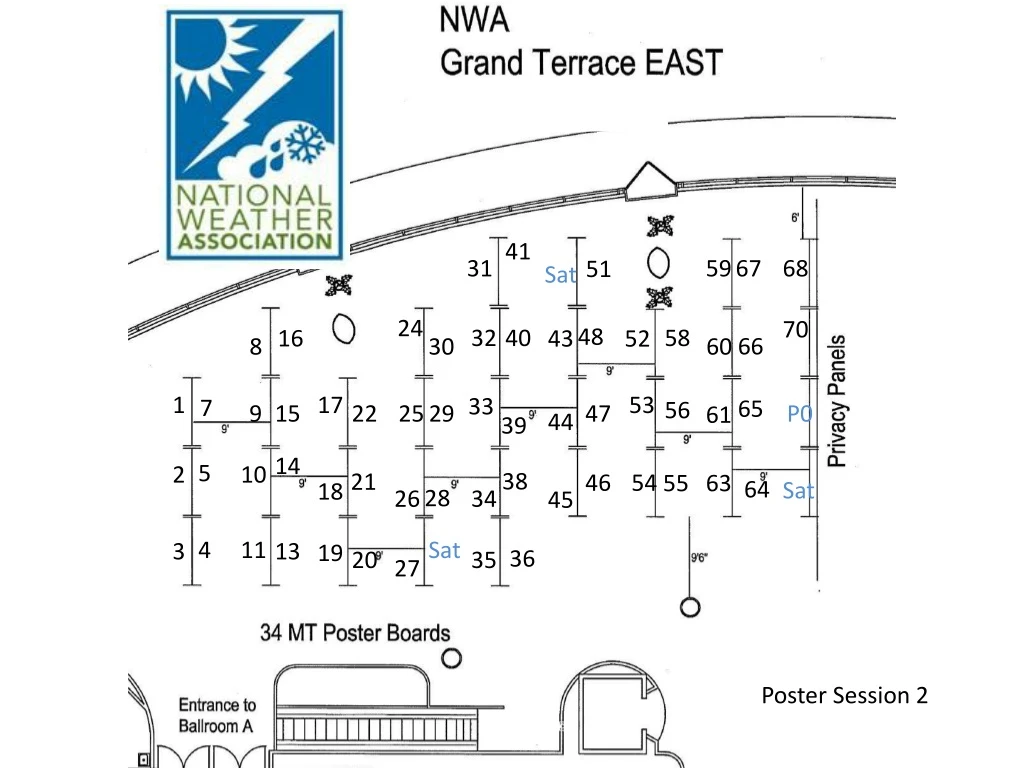
41 31 59 67 68 51 Sat 24 70 48 32 40 58 16 43 52 66 8 30 60 1 17 53 33 7 65 56 9 15 22 25 29 47 P0 61 44 39 14 5 2 10 38 21 46 54 55 63 64 Sat 18 28 26 34 45 4 11 Sat 3 13 19 36 20 35 27 Poster Session 2
SATCON for Hurricane Nadine 2012 Jeff Hawkins (Naval Research Lab Monterey, CA) • 95 % of all TC intensity estimates • come from satellite imagery • Objective methods used for • estimating TC intensity vary in • skill based on imagery type, TC • structure and TC/satellite • geometry • SATCON produces a weighted • consensus estimate by combining • objective intensity estimates from • multi-spectral imagery • Accurate assessment of current • intensity improves forecasts and • historical intensity data. CIMSS SATellite CONsensus (SATCON) Algorithm for Estimating the Intensity of Tropical Cyclones 85 -91 GHz 53-55 GHz Infrared Derrick Herndon and Chris Velden (Univ of Wisc CIMSS) P2.2
The UW-CIMSS Advanced Dvorak Technique (ADT) TIMOTHY OLANDER and Christopher Velden University of Wisconsin-Madison Cooperative Institute for Meteorological Satellite Studies • Development Overview • Current Algorithm Status • Statistical Comparisons • Future Directions P 2.5
A Cloud to Ground (CG) Lightning Climatology for the Lake Superior Region Steven Fleegel and Michael Dutter NOAA/National Weather Service – Marquette, MI A mesoscale look at the influence of the Great Lakes on lightning in the Lake Superior region General (Monthly, Seasonal, and Hourly) lightning climatology Focus on 700 hPa wind direction and speed climatology, displayed using gridded 1 km2 lightning density charts Additional investigation on role terrain and land use have with lightning density Summer 700 hPa Flow – Lightning Climatology National Weather Association Annual Meeting 2012 Madison, WI P2.19
Gales of September? Analysis and Customer Impacts of the 03-04 Sept. High Wind Event across Lake Superior Michael Dutter NOAA/National Weather Service Marquette, MI The Labor Day Weekend 2010 wind storm was arguably the strongest September Wind Storm across Lake Superior in the last 30 years Numerous wind and wave records were broken or nearly broken Wind gusts in excess of 50 m/s reported by the M/V Indiana Harbor Unusual low track for high winds across Lake Superior Wind Speed Analysis from 22 UTC 09/03/2010 (courtesy GLERL) National Weather Association Annual Meeting 2012 Madison, WI P2.20
Lightning has Fallen to Third Leading Sourceof Storm Deaths in the U.S. William P. Roeder Private Meteorologist Rockledge, FL Lightning Now #3 Source of U.S. Storm Deaths Tornadoes Now #2 Statistically Significant New Analysis Accounts for Lightning’s Declining Fatality Rate Poster 2.29 National Weather Association Annual Meeting 2012 Madison, WI P2.29
Lightning Safety Applications ofNOAA’s New Lightning Fatality Database William P. Roeder John Jensenius Private Meteorologist National Weather Service Rockledge, FL Gray, ME New Lightning Fatality Databasefrom NOAA U.S. (2006 – Present) 16 New Graphics for TeachingLightning Safety Available On-line www.lightningsafety.noaa.gov Poster 2.30 National Weather Association Annual Meeting 2012 Madison, WI P2.30
An Examination of Decision Support Services Provided by the National Weather Service During Major Winter Storms Dennis VanCleve and Marcia Cronce, NOAA/NWS WFO Milwaukee/Sullivan, WI Jamie Enderlen, NOAA/NWS WFO Chicago, IL Three storms studied January 1-3, 1999 Blizzard; February 5-6, 2008 Winter Storm; 2011 Groundhog Day Blizzard Past DSS What services were provided? How have they improved? Future DSS Continue & improve upon successful services Develop new impact-based services tailored to users needs Stranded vehicles during February, 2008 winter storm National Weather Association Annual Meeting 2012 Madison, WI P2.33
MetEd Resources for Weather and Natural Hazards Decision Support AmyStevermer, Victoria Johnson, Elizabeth Mulvihill Page, Wendy Schreiber-Abshire UCAR/COMET, Boulder, CO What information do emergency managers and the aviation industry need in their operations? Online modules overview preparedness and response efforts related to tsunamis, hurricanes, hazmat releases, and other events Aviation-related training explores impacts of space weather, volcanic ash, and various weather events on air traffic management Some of the available module titles… and more…free at www.meted.ucar.edu National Weather Association Annual Meeting 2012 Madison, WI P2.38
Analysis of Tornado Debris During the April 27, 2011 Super Outbreak as Determined Using Social Media Data John A. Knox, J.A. Rackley, A.W. Black, V.A. Gensini, M. Butler, M. Phan, C. Dunn, T. Gallo, M.R. Hunter, L. Lindsey, R. Scroggs, and S. Brustad Department of Geography, University of Georgia et al. We used a Facebook page of lost-and-found items from a tornado outbreak to create a scientific dataset: 934 objects, most ever studied Farthest-traveled object: 353 km, new record! Longest trajectories to right of average tornado track vector, new result HYSPLIT modeling suggests a reason why Tracks of debris objects that traveled a) < 50 km; b) 50 to 150 km; c) 150 to 250 km; d) >250km National Weather Association Annual Meeting 2012 Madison, WI P2.46
Persistent Daytime Superadiabatic Surface Layers Observed by a Microwave Temperature Profiler Alan C. Czarnetzki University of Northern Iowa Cedar Falls, IA • Surface based microwave radiometers can measure atmospheric thermodynamics in real time • Superadiabatic layers are persistent features of the daytime boundary layer • Only the lowest, surface-based layer is occasionally seen to be autoconvective • Superadiabatic layers should not be summarily dismissed as erroneous or transient Example of near-surface superadiabatic layer observed by a microwave radiometer National Weather Association Annual Meeting 2012 Madison, WI P2.55
National Weather Association Annual Meeting 2012 Madison, WI MOS Probabilistic Winter Weather Guidance: Prototype Products for “Weather-Ready Nation” Pilot Initiative Phillip E. Shafer*, Geoffrey A. Wagner**, and Kenneth Widelski*** *NWS/MDL Silver Spring, MD **AceInfo Solutions, Inc., Reston, VA ***NWS WFO Sterling, VA Pilot project at WFO Sterling: Objective – develop suite of probabilistic forecast products for winter weather for impact-based decision support services. MDL has developed two prototypes: GFS-based MOS probabilistic precipitation type GFS-based MOS probabilistic 24-h snowfall amount Provides uncertainty information to support Pilot Project objectives. P2.63
National Weather Association Annual Meeting 2012 Madison, WI MOS Precipitation Forecasts Formatted for the National Digital Forecast Database Tabitha L. Huntemann, Phillip E. Shafer, Matthew R. Peroutka, Kathryn K. Gilbert NOAA/NWS/MDL Silver Spring, MD NDFD "Weather" element contains precipitation type, probability, and intensity information Gridded MOS guidance for "Weather" has been developed Adds to MOS product suite of guidance for NWS forecasters None Rain Snow Ice Mix Severe Gridded MOS WeatherFebruary 28, 2012 00Z 33-h forecast P2.64
Preliminary Results of AutoNowCaster Over a Large Domain Mamoudou Ba1, Lingyan Xin1, John Crockett1, Kenneth Sperow1, Tatiana Gonzalez1, RitaRoberts2, Eric Nelson2, Dan Megenhardt2, Amanda Anderson2, Eric Lenning3, Patricia Wontroba31NOAA/NWS, Meteorological Development Laboratory, Silver Spring, MD 209102NCAR, Boulder, CO 80301; 3NOAA/NWS, WFO Chicago, Romeoville, IL 60446 Derecho event on June 29, 2012 • AutoNowCaster (ANC) • Automatic, deterministic nowcasts • Rapid updates (every 5 to 6 minutes) • 60-minute nowcasts of the likelihood of new thunderstorm initiation • 60-minutes nowcasts of the advection of existing thunderstorms (including growth and decay) • The thunderstorm initiation nowcast is designed to alert forecasters quickly to areas where new convection is likely to occur in 60 minutes. ANC 60-minute storm advection (values >= 35 dBZ). White contours are reflectivities >=35 dBZ. ANC initiation likelihood nowcast valid at 1907Z on Sept. 17, 2012. White contours are reflectivities >=35 dBZ. P2.65
National Weather Association Annual Meeting 2012 Madison, WI The Expansion of Lightning Toolkits to Outdoor Recreation Charles Woodrum, NOAA/NWS, Pittsburgh, PA Karen Oudeman, NOAA/NWS, Cleveland, OH Michael Kyle, Kean University, Union, NJ Ellen Bryan, WTVQ-TV, Lexington, KY Lightning safety toolkits now available for a broad spectrum of vulnerable outdoor recreation activity. Sign art available to those who complete a toolkit. P0.12
41 31 59 67 68 51 Sat 24 70 48 32 40 58 16 43 52 66 8 30 60 1 17 53 33 7 65 56 9 15 22 25 29 47 P0 61 44 39 14 5 2 10 38 21 46 54 55 63 64 Sat 18 28 26 34 45 4 11 Sat 3 13 19 36 20 35 27 Poster Session 2