Download
1 / 43
430 likes | 455 Views
Explore microbial diversity & community structure along gradients with sequence-based & non-sequence-based methods. Learn how to define OTUs & analyze ecotypes with t-RFLP & ARISA techniques. Understand the factors influencing microbial communities.

E N D
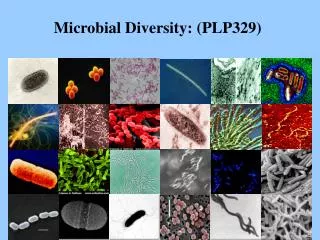
Sampling microbial diversity using fragment analysis: When is an OTU an ESU?
Patterns of microbial diversity and community composition • What factors regulate community diversity and composition? • How do humans influence microbial communities? • Does microbial diversity change along environmental gradients? • Do communities from different locations (treatments) differ? • Are there patterns of community structure?
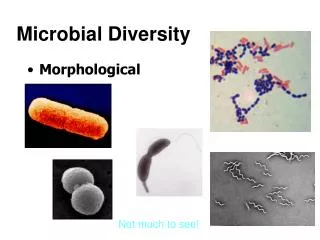
What are we measuring? Species? Operational Taxonomic Units? Ecotypes? • Sequence based diversity estimates • • which gene? • • how much to sequence? • how to define OTUs? (95%, 97%, 99%--non transitive relationships) • Non-sequence based diversity estimates • • tRFLP, ARISA, SNPs, AFLP • • Often quick, cheap, easy • • Only a proxy for actual sequence diversity present • For tRFLP, ARISA one peak = 1 OTU (or does it?)
Compare OTUs to ESUs Evolutionarily Significant Unit
GG CC GG CC GGTC GG CC CC GG CC GG CCAG CC GG Separate by size Type A Type B markers 1000 bp 750 bp Smaller fragments 500 bp 250 bp Restriction Fragment Length Polymorphisms Type A Type B GGCC GGCC GGTC GGCC CCGG CCGG CCAG CCGG
high B/A low B/A MIT9201 MIT9302 MIT9211 MIT9215 MIT9312 MIT9313 MIT9202 MED4 MIT9303 SS120 1500 bp 1000 bp 500 bp 100 bp RFLPs of individuals RsaI digests of the ITS-23S rRNA distinguish Prochlorococcus ecotypes
markers 1000 bp Type A 750 bp Type B 500 bp 250 bp t-RFLP= terminal Restriction Fragment Length Polymorphism Use 1 Fluorescently labeled primer in PCR Digest with restriction enzyme Run fragments on gel—Visualize using fluorescence detector Only bands containing fluorescent primer are seen
Each sequence in pool represented by single peak (barring incomplete digestion issues) Each peak treated as OTU What is the level of sequence diversity within a peak? DEPENDS….. Relative Fluorescence Units DNA (bp)
ARISA---Automated Ribosomal Intergenic Spacer Analysis Based on length differences in rRNA intergenic spacer 16S rRNA 23S rRNA Fisher and Triplett AEM 1999
Intergenic spacer lengths can be variable at fine phylogenetic scales Rocap et al 2002 AEM
Separate by size sample markers 1000 bp Relative fluorescence units (RFUs) 750 bp Smaller fragments 500 bp 250 bp DNA (base pairs) ARISA---Automated Ribosomal Intergenic Spacer Analysis Strategy: Amplify intergenic spacer using primers (universal or group specific) targeted to conserved positions in rRNA genes 16S rRNA 23S rRNA or
Salinity 60 50 40 OTUs 30 20 10 0 0 10 20 30 (PSU) What can we do with these OTUs? Community A B C Community analyses Treat each OTU as a “taxonomic unit of richness” Regression Richness - how many? Does richness vary with the environment? R2 = 0.96 p = 0.0019
2a X 100 2a + b + c S i t e A S i t e B S i t e C S i t e D S i t e E S i t e A S i t e B S i t e C S i t e D S i t e E OTU 1 1 1 1 0 1 S i t e A 1 OTU 2 1 1 0 1 0 S i t e B x 1 OTU 3 0 1 1 0 0 S i t e C x x 1 OTU 4 0 0 1 1 0 S i t e D x x x 1 OTU 5 0 1 1 0 0 S i t e E x x x x 1 OTU 6 1 0 1 0 0 Community Analyses Community A B C Incidence matrix Similarity matrix Sorensen similarity coefficient where a = # OTUs in both b = # OTUs in X only c = # OTUs in Y only
Community analyses Community A B C Community composition - who? Does composition vary with the environment? Analysis of Similarity (ANOSIM & NMDS) Pasture composition differed from forest & plantation composition (p<0.001). Carney et al. (2004) Ecology Letters
The sample set: active and inactive carbonate chimneys Young, hot, actively chimneys: 40-85ºC, pH 9-11 Chimney containing minerals exposed to both hot fluids and background SW Old chimneys with little or no venting: <10ºC, pH 8 Brazelton et al. 2006
Ecological succession of Lost City Archaea (WJ Brazelton, 2006)
What size is a peak anyway? Fluorescent size standard Fluorescently labelled PCR product RFU’s 142 190 170 160 150 120 DNA (BP)
What size is a peak anyway? 233.2 210.0 167.8 ?
Solutions? Thresholds for peak calling-- signal:noise cutoff % area or % peak height cutoff helps to standardize amount of DNA loaded onto gel (ie 10ng) Binning-- at minimum data must be binned in 1bp bins so 233.2 and 233.3 are counted as the same fragment typically 1-3 bp bins < 500 bp 3-5 bp 500-1000 bp 10 bp > 1000 bp
Iterative binning strategy Use maximal similarity between two samples to address null hypothesis that communities are different Hewson and Fuhrman 2006 Microbial Ecology
T-RFLP specific issues : which enzymes to pick? How many to use? In silico analysis of 4603 bacterial SSU rRNA sequences and 18 common REs Engebretson and Moyer, 2003 AEM
But what if……? • You already have a clone library from the same/related environment • You are using group specific primers to differentiate subtypes of interest • You are using a locus other than the SSU rRNA (functional gene, ITS etc….) Then how do you choose enzymes?
REPK: Restriction enzyme picker Rationally chooses enzymes that discriminate user-defined sequence groups Collins and Rocap, 2007 NAR http://rocaplab.ocean.washington.edu/tools/repk
REPK: Restriction enzyme picker http://rocaplab.ocean.washington.edu/tools/repk
REPK: Output Terminal fragment lengths of all sequences with all enzymes http://rocaplab.ocean.washington.edu/tools/repk
REPK: Output Visual view of which enzymes are capable of distinguishing each user-defined group http://rocaplab.ocean.washington.edu/tools/repk
REPK: Output Enzymes are binned together based on their ability to discriminate groups http://rocaplab.ocean.washington.edu/tools/repk
REPK: Final Output Sets of enzymes that together can distinguish all user defined sequence groups http://rocaplab.ocean.washington.edu/tools/repk
Automated Ribosomal Intergenic Spacer in silico Analysis (ARISISA)355 complete bacterial genomes in GenBank Wrabel and Rocap
Fragment lengths: predominant bacterial phyla Genera/species
70 Alpha-Proteobacteria Actinobacteria 0 Bacteroidetes/Chlorobi Beta- Delta- Chlamydiae Sequences Cyanobacteria Epsilon- Firmicutes Gamma- A single ARISA peak can represent more than one group or species of bacteria. Some groups display minimal overlap. ARISA fragment lengths (bps)
Intraspecific variability in ARISA peaks due to multiple operons Number of ribosomal operons: 1 – 15 Predicted ARISA peaks per strain: 1 - 9!!
Time to play ARISA detective … A B Relative fluorescence units (RFUs) C APhotobacterium profundum B 2 Prochlorococcus strains, 3 Synechococcus strains. CColwellia psychrerythraea DNA (base pairs) 0 1500
Intraspecific variability in ARISA peaks due to multiple operons 7 Prochlorococcus, 7 Synechococcus Colwellia psychrerythraea Geobacillus kaustophilus, Photobacterium profundum Vibrio cholerae Number of ribosomal operons: 1 – 15 Predicted ARISA peaks per strain: 1 - 9!!
Bacteria associated with the diatom Pseudo-nitzchia Kaczmarska et al. 2005 Harmful Algae
Relative fluorescence units (RFUs) DNA (base pairs) Automated Ribosomal Intergenic Spacer Analysis (ARISA) ITS (variable) 23S 16S amplify ITS with fluorescent label gram + bacteria DNA extraction 3 µm AB 0.2 µm FLB 2 ng exponential stationary run on capillary sequencer with internal size standard 10 ng PCR product, purified
P. delicatissimaP. pungensChaetoceros socialisDitylum brightwelliiThalassiosira sp. Are diatom-associated bacterial assemblages found among field data? YES Isolates + field filters from 3 stations: P1, P17, P38
19 Pseudo-nitzschia spp. 8 Ditylum brightwellii 2 Thalassiosira sp. 1 Chaetoceros socialis Origins of diatom isolates P. multiseries P. australis, P. fraudulenta P. callianthaP. cuspidata (tentative ID) P. delicatissimaP. multiseriesP. pungensC. socialisD.brightwelliiThalassiosira sp.
Patterns related to Pseudo-nitzschia species? Null hypothesis: Bacterial assemblages are the same between Pseudo-nitzschia species. R = 1; p = 0.01 Bacterial assemblages differ with Pseudo-nitzschia species. Michele Wrabel
Conclusions Fragment analysis methods offer a means to interrogate a large number of samples fairly rapidly and inexpensively Ability to ask (and answer!) ecological questions about microbial communities Important to be aware of both the strengths and limitations of the techniques to interpret data correctly
Thanks to the F.A.M.O.U.S. gang Billy Brazelton Eric Collins Colleen Evans Clara Fuchsman Claire Horner-Devine Kate Hubbard Andrew Opatkiewicz Jess Silver Michele Wrabel
ARISA---Automated Ribosomal Intergenic Spacer Analysis Partial ARISA profiles of the bacterial communities in Crystal Bog Lake (A), Lake Mendota (B), and Sparkling Lake (C) during the summer of 1998. In each panel, the red and black electropherograms represent duplicate PCRs that were performed on a single sample from each site. Fisher and Triplett AEM 1999