Download
1 / 43
430 likes | 555 Views
Discovering regulatory and signalling circuits in molecular interaction network. I deker Bioinformatics 2002 Presented by: Omrit Zemach April 3 2013. Seminar in Algorithmic Challenges in Analyzing Big Data* in Biology and Medicine-TAU. outline. Introduction- biological terms

E N D
Discovering regulatory and signalling circuits in molecular interaction network Ideker Bioinformatics 2002 Presented by: OmritZemach April 3 2013 Seminar in Algorithmic Challenges in Analyzing Big Data* in Biology and Medicine-TAU
outline • Introduction- biological terms • Motivation • Methods • Basic z-score calculation • simulated annealing • Results • Discussion
Protein-Protein interaction • All living organisms consist of living cells • All those cells, comprise the same building blocks: • RNA ,DNA and PROTEIN • Protein sequences are encoded in DNA • Proteins play major roles in all cellular processes
DNA REPLICATION TRANSCIPTION INTO mRNA TRANSLATION OF mRNA
Protein-DNA interactions • protein binds a molecule of DNA • Regulate the biological function of DNA, usually the expression of a gene. • Transcription factors that activate or repress gene expression
Gene Expression • Gene is a sequence of the DNA . • The gene decodes to a protein. • the process by which information from a gene is used in the synthesis of a functional protein is called gene expression • It is interesting to test gene expression on multiple conditions (experiments). Differential-express
DNA chips/ Microarrays-Simultaneous measurement of expression levels of all genes.
Motivation Databases of PROTEIN-PROTEIN & PROTEIN-DNA interactions Widely available mRNA expression data Generate concrete hypotheses for the underlying mechanisms governing the observed changes in gene expression
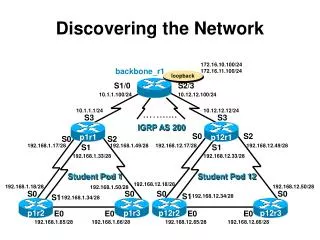
Motivation • Exposing the yeast galactose utilization pathway to 20 perturbations • Constructing a molecular interaction network by screening a database of protein-protein and protein-DNA interactions • Select 362 interactions linking genes that were differentially-expressed under one or more perturbations . • Analyze changes in expression.
Conclusion: Pairs of genes linked in this network were more likely to have correlated expression profiles than genes chosen at random however, the general task of Associating gene expression changes with higher order groups of interaction was not discussed
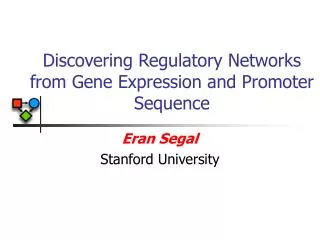
Discovering regulatory and signaling circuits in molecular interaction networks • Introducing method for searching the networks to find ‘active sub-networks’ • On multiple conditions , determine which conditions significantly affect gene expression in each subnetwork.
Z-score calculation • Given each gene i a value pi • pi= The significance of differential expression of gene I • zi= Ф-1 (1- pi) ( z-score for gene i) • aggregatez-score for subnetwork A • Calibrating z against the background distribution
Scoring over multiple conditions • Extending the scoring system over multiple conditions . • Create a matrix of z-score . Rows- m conditions Columns-genes • Produce m different aggregate scores (one for each condition • Sort them from highest to lowest. • compute rAmax= max j (rA[j] )
compute rAmax • Compute rA[j] for each j=1….m as follows: • PZ = 1 – Ф( ZA[j] ) (the probability that any single condition has a z-score above ZA[j] ) • b (the probability that at least j of the m conditions had scores above ZA[j] ) • rA[j] = Ф-1 (1-pA[j) ) • rAmax= max j (rA[j] )
Z score of gene 1 Condition 1 Condition 2 Condition 3 Condition 4
Aggregate scores of zA1 ….. zAmc Computing rA[1] … rA[m] Calibrating z against the background distribution Aggregate scores of zA1 ….. zAmsorted • Taking max j (rA[j] )
Simulated annealing • strategy to find local maximum • we must sometimes select new points that do not improve solution • Annealing- Gradual cooling of liquid • Incorporate a temperature parameter into the maximization procedure • At high temperatures, explore parameter space • At lower temperatures, restrict exploration
Simulated Annealing Strategy • Start with some sample • Propose a change • Decide whether to accept change
Simulated Annealing Strategy • Decide whether to accept change- • HOW?? • Consider decreasing series of temperatures • For each temperature, iterate these steps: Propose an update and evaluate function • Accept updates that improve solution • Accept some updates that don't improve solution Acceptance probability depends on “temperature” parameter
Searching for high scoring subnetworks via simulated annealing • Associate an active/inactive state with each node • GW = denote the working sub graph of G induced by the active nodes
Heuristics for improved annealing • Search for M subnetworks simultaneously • Increasing the efficiency of annealing in networks with many ‘hubs’
Solution- changing step 3 • Defining dmin at the beginning of the algorithm • If deg(node)> dmin • Remove all neighbors that are not in the top scoring component
Results Z-scores Small network with a single perturbation 7.7 3.1 2.8 2.5 2.3
Simulated annealing was preformed with parameters: • N=100,000 • Tstart= 1 • Tend= 0.01 • M=5 • dmin=100
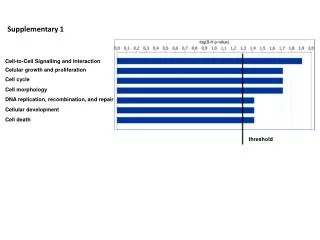
Distribution of sub-network score in actual and randomized data
Subnetworks versus gene expression clusters • Our approach groups genes subject to the constraints of molecular interaction network • Subnetworks are scored over only a subset of conditions • Groups genes only by the significance of change, while clustering methods groups genes by both magnitude and direction of change • Our method leaves some genes unaffiliated with any subnetwork, unlike clustering which assign every gene to distinct cluster
Future work • Investigating the subnetworks we found in the laboratory • Accommodating new types of interaction networks (protein and small molecules) • Annotating each interaction with its directionally compartments