Download
1 / 11
110 likes | 232 Views
Transmission. Larry Flowers AWEA. Wind Power in Queues (MW). Washington 5,831. VT 155. Montana 2,327. Maine 1,398. North Dakota 11,493. Minnesota 20,011. NH 396. Oregon 9,361. South Dakota 30,112. Wisconsin 908. Idaho 446. New York 8,000. MA 492. Wyoming

E N D
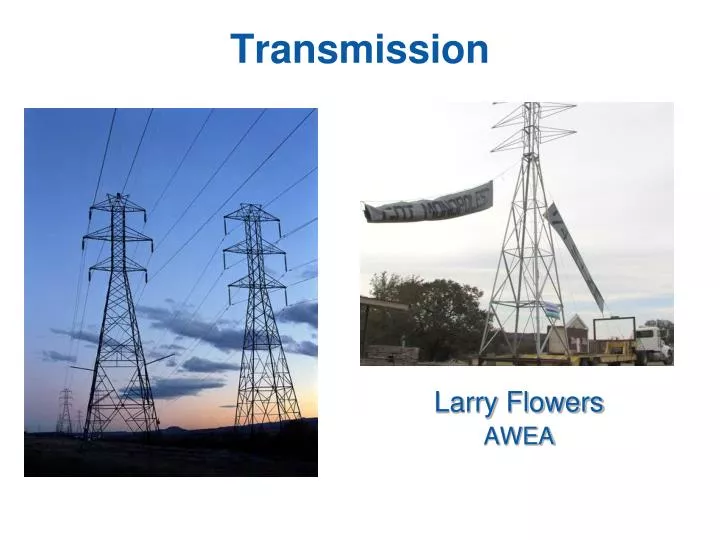
Transmission Larry Flowers AWEA
Wind Power in Queues (MW) Washington 5,831 VT 155 Montana 2,327 Maine 1,398 North Dakota 11,493 Minnesota 20,011 NH 396 Oregon 9,361 South Dakota 30,112 Wisconsin 908 Idaho 446 New York 8,000 MA 492 Wyoming 7,870 Michigan 2,518 RI 347 Iowa 14,569 Penn. 3,391 Nevada 3,913 Nebraska 3,726 NJ 1416 IN 8,426 Ohio 3,683 Illinois 16,284 Utah 1,052 WV 1,045 DE 450 Colorado 16,602 Kansas 13,191 VA 820 California 18,629 MD 810 Missouri 2,050 Oklahoma 14,677 Arizona 7,268 Under 1000 MW 1,000 MW-8,000 MW Over 8,000 MW New Mexico 14,136 Arkansas 210 Texas 63,504 Total 311,155 MW Source: AWEA National Renewable Energy Laboratory Innovation for Our Energy Future
Lots of wind, Lots of load, Lots of distance Best Onshore Wind Resources Highest Load
Annual Load Weighted LMP Source: MISO
RPS Policies www.dsireusa.org / May 2011 ME: 30% x 2000 New RE: 10% x 2017 VT: (1) RE meets any increase in retail sales x 2012; (2) 20% RE & CHP x 2017 WA: 15% x 2020* MN: 25% x 2025 (Xcel: 30% x 2020) MT: 15% x 2015 NH: 23.8% x 2025 MA: 22.1% x 2020 New RE: 15% x 2020(+1% annually thereafter) MI: 10% & 1,100 MW x 2015* ND: 10% x 2015 OR: 25% x 2025(large utilities)* 5% - 10% x 2025 (smaller utilities) SD: 10% x 2015 WI: Varies by utility; 10% x 2015 statewide RI: 16% x 2020 NY: 29% x 2015 CT: 23% x 2020 NV: 25% x 2025* IA: 105 MW OH: 25% x 2025† PA: ~18% x 2021† CO: 30% by 2020(IOUs) 10% by 2020 (co-ops & large munis)* IL: 25% x 2025 WV: 25% x 2025*† NJ: 20.38% RE x 2021 + 5,316 GWh solar x 2026 CA: 33% x 2020 KS: 20% x 2020 UT: 20% by 2025* VA: 15% x 2025* MO: 15% x 2021 MD: 20% x 2022 AZ: 15% x 2025 OK: 15% x 2015 DE: 25% x 2026* NC: 12.5% x 2021(IOUs) 10% x 2018 (co-ops & munis) NM: 20% x 2020(IOUs) 10% x 2020 (co-ops) DC DC: 20% x 2020 PR: 20% x 2035 TX: 5,880 MW x 2015 HI: 40% x 2030 29 states + DC and PR have an RPS (7 states have goals) Renewable portfolio standard Minimum solar or customer-sited requirement * Renewable portfolio goal Extra credit for solar or customer-sited renewables † Solar water heating eligible Includes non-renewable alternative resources
Transmission Acceptance • “If you like wind, you have to at least accept transmission” (paraphrase from Xcel COO) • Transmission is < 10% of electricity system cost • Relatively small amount of transmission has been built in last decade in US • Historically, economics and utility eminent domain ruled the day • 20% Wind: 12,000-19,000 miles of new HV transmission required • Distributed (community) wind will not substantially reduce need for significant transmission build out National Renewable Energy Laboratory Innovation for Our Energy Future
Transmission Acceptance (cont’d) • U.S. is heavily engaged in regional transmission route options analysis & planning (e.g., EWITS, WECC, WGA, RMATS, SPP, ERCOT) • Identification of Competitive Renewable Energy Zones (CREZ) at the state and regional level helps focus the analyses • Federal lands corridors identified but not thoroughly vetted with stakeholders • Several states and their utilities are active in stakeholder and community engagement (e.g., TX, CA, MN, MT) • Some innovative approaches being taken to secure stakeholder involvement and acceptance (e.g., MATL, CA RETI, HART, CAPEX 2020); traditional stakeholder processes ineffective • Basic approach: convince stakeholders that transmission is both needed (e.g. to meet state RPS) and transcends utility interests • More local, more difficult • Multi-state cooperation is critical, but politically difficult • Economic development potentials creating inter-regional stress National Renewable Energy Laboratory Innovation for Our Energy Future
Six “P’s” of Transmission • Planning • Permitting • Paying • PUC’s • Public • Policy National Renewable Energy Laboratory Innovation for Our Energy Future