Download
1 / 1
10 likes | 125 Views
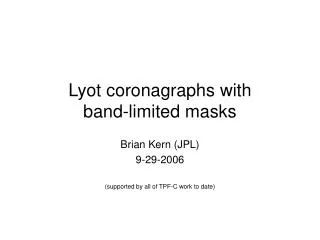
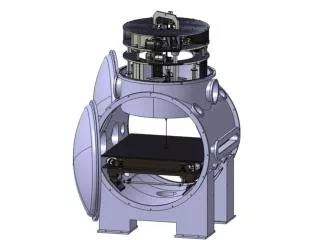
Development of Coronagraphs for Exoplanet Detection with SPHERE. HW-4QPM structure (scaled to the defocus range). MgF2. Quartz. A ir. 18 m Spider arms. 530 µm. Position Of best Nulling. Nulling (attenuation on Peak).

E N D
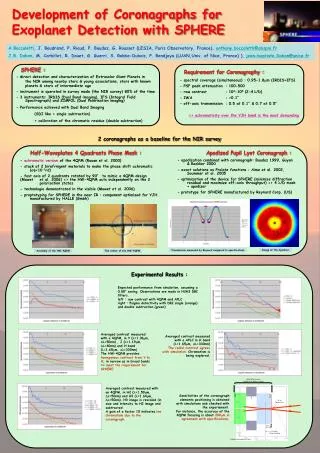
Development of Coronagraphs for Exoplanet Detection with SPHERE HW-4QPM structure (scaled to the defocus range) MgF2 Quartz Air 18 m Spider arms 530 µm Position Of best Nulling Nulling (attenuation on Peak) Boccaletti, J. Baudrand, P. Riaud, P. Baudoz, G. Rousset (LESIA, Paris Observatory, France),anthony.boccaletti@obspm.fr J.B. Daban, M. Carbillet, R. Douet, G. Guerri, S. Robbe-Dubois, P. Bendjoya (LUAN,Univ. of Nice, France)), jean-baptiste.Daban@unice.fr SPHERE : Requirement for Coronagraphy : - direct detection and characterization of Extrasolar Giant Planets in the NIR among nearby stars & young associations,stars with known planets & stars of intermediate age - instrument is operated in survey mode (the NIR survey) 80% of the time - 3 instruments: IRDIS (Dual Band imaging), IFS (Integral Field Spectrograph) and ZIMPOL (Dual Polarisation imaging) - Performance achieved with Dual Band Imaging (SDI like = single subtraction) + calibration of the chromatic residue (double subtraction) - spectral coverage (simultaneous) : 0.95-1.8m (IRDIS+IFS) - PSF peak attenuation : 100-500 - raw contrast : 104-105 (2-4/D) - IWA : >0.1” - off-axis transmission : 0.5 at 0.1” & 0.7 at 0.5” => achromaticity over the YJH band is the most demanding 2 coronagraphs as a baseline for the NIR survey Half-Waveplates 4 Quadrants Phase Mask : Apodized Pupil Lyot Coronagraph : - apodization combined with coronagraph: Baudoz 1999, Guyon & Roddier 2000 - exact solutions as Prolate functions : Aime et al. 2002, Soummer et al. 2005 - optimization of the device for SPHERE (minimize diffraction residual and maximize off-axis throughput) => 4 /D mask + apodizer - prototype for SPHERE manufactured by Reynard Corp. (US) - achromatic version of the 4QPM (Rouan et al. 2000) - stack of 2 birefringent materials to make the phase shift achromatic (<10-1rd) - fast axis of 2 quadrants rotated by 90° to mimic a 4QPM design (Mawet et al. 2006) => the HW-4QPM acts independently on the 2 polarisation states - technologie demonstrated in the visible (Mawet et al. 2006) - proptotyping for SPHERE in the near IR : component optimized for YJH. manufactured by HALLE (Gmbh) Image of the Apodizer Transmission measured by Reynard compared to specifications Assembly of the HW-4QPM The center of the HW-4QPM Experimental Results : Expected performance from simulation, assuming a 0.85” seeing. Observations are made in H2H3 DBI filters. left : raw contrast with 4QPM and APLC right : 5sigma detectivity with DBI single (orange) and double subtraction (green) Averaged contrast measured with a 4QPM, in Y (=1.06m, =50nm) , J (=1.19m, =40nm) and H band (=1.65m, =330nm) The HW-4QPM provides homegenous contrast from Y to H, in narrow as in broad bands => meet the requirement for SPHERE Averaged contrast measured with a APLC in H band (=1.65m, =330nm) The radial contrast agrees with simulation. Chromatism is being explored. Averaged contrast measured with an 4QPM, in H2 (=1.59m, =50nm) and H3 (=1.64m, =50nm). H3 image is rescaled (in size and intensity to H2 image and subtracted. A gain of a factor 10 indicates low chromatism due to the coronagraph. Sensitivities of the coronagraph elements positioning is obtained with simulations anb checked with the experiement. For instance, the accuracy of the 4QPM focusing is about 200m in agreement with specifications.