Download
1 / 36
360 likes | 501 Views
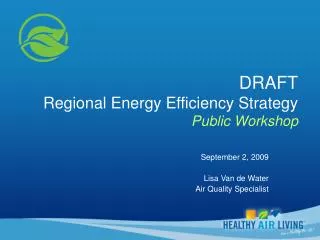
DRAFT Regional Energy Efficiency Strategy Public Workshop. September 2, 2009 Lisa Van de Water Air Quality Specialist. Regional Energy Efficiency Strategy – the basics.

E N D
DRAFTRegional Energy Efficiency StrategyPublic Workshop September 2, 2009 Lisa Van de Water Air Quality Specialist
Regional Energy Efficiency Strategy – the basics • Long-range strategy to programmatically encourage & incentivize non-regulatory emissions reductions through energy efficiency • Regional, coordinated approach to EE • Partnership with & leveraging of existing EE programs (utilities, regional partners) to maximize efficiency & emissions reductions
Overview • 2007 Ozone Plan – Dual-path Strategy • Electricity Production & Consumption • REES Components • ARRA “kick-start” • Review Schedule • Questions & Comments
2007 Ozone Plan • Attainment of 8-hour federal ozone standard • Significant Challenges • Topography • Meteorology • “Dual-path” strategy • Regulatory Measures • “Black-Box” – Fast Track Strategy
2007 Fast TrackEmission Reduction Measures • Green Contracting • Green Fleets • Truck Replacement/Retrofit/Repower • Short Sea Shipping • High-Speed Rail • Alternative Energy • Energy Conservation – Efficiency • Heat Island Mitigation • Episodic/Regional Controls • Inland Ports
“Green” Clean Air Opportunity • Need for non-regulatory emissions reductions • AB 32 greenhouse gas reductions • American Recovery & Reinvestment Act • Significant energy efficiency & renewable energy dollars • Economic stimulus
Complexity of Electricity • Production • What resource: fossil fuel or renewables • Where: local or imported • How clean: what are the byproducts • Cost: base load versus peak load • Consumption • Who: sectors • When: off-peak or peak • For what: critical systems or household appliances
Complexity of Electricity • Production • What resource: fossil fuel or renewables • Where: local or imported • How clean: what are the byproducts • Cost: base load versus peak load • Consumption • Who: sectors • When: off-peak or peak • For what: critical systems or household appliances
Complexity of Electricity • Production • What resource: fossil fuel or renewables • Where: local or imported • How clean: what are the byproducts • Cost: base load versus peak load • Consumption • Who: sectors • For what: critical systems or household appliances • When: off-peak or peak
Electricity Use & Air Quality * NOx SOx Source: eGRID2007 Version 1.0, Year 2005 Summary Tables (created in 2008) CAMX
Electricity Generation Resource Mix back All Fossil Fuels CAMX – 56% US – 72% Source: eGRID2007 Version 1.0, Year 2005 Summary Tables (created in 2008) CAMX = 0.24% US = 0.01%
California Major Utilities' Resource Mix Resource Type Statewide SCE PG&E SDG&E LADWP SMUD Coal 15.7% 8.0% 3.0% 18.0% 48.0% 0.0% Large Hydro 19.0% 5.0% 19.0% 10.0% 6.0% 47.0% Natural Gas 41.5% 54.0% 42.0% 50.0% 30.0% 41.0% Nuclear 12.9% 17.0% 23.0% 15.0% 10.0% 0.0% Renewables 10.9% 16.0% 13.0% 8.0% 6.0% 12.0% Biomass 2.1% 2.0% 5.0% 3.0% 1.0% 3.0% Geothermal 4.7% 9.0% 2.0% 2.0% <1% 3.0% Small Hydro 2.1% 1.0% 4.0% <1% 4.0% 3.0% Solar 0.2% 1.0% 0.0% <1% <1% 1.0% Wind 1.8% 3.0% 2.0% 3.0% 1.0% 2.0% SOURCE: CEC Website Data - 2006 http://energyalmanac.ca.gov/electricity/electricity_resource_mix_pie_charts/index.html
Complexity of Electricity • Production • What resource: fossil fuel or renewables • Where: local or imported • How clean: what are the byproducts • Cost: base load versus peak load • Consumption • Who: sectors • For what: critical systems or household appliances • When: off-peak or peak
Base Load & Peak Load Winter Summer Power Demand Power Demand Peak Peak Intermediate Intermediate Base Base Time of Day Time of Day
Complexity of Electricity • Production • What resource: fossil fuel or renewables • Where: local or imported • How clean: what are the byproducts • Cost: base load versus peak load • Consumption • Who: sectors • For what: critical systems or household appliances • When: off-peak or peak
Complexity of Electricity • Production • What resource: fossil fuel or renewables • Where: local or imported • How clean: what are the byproducts • Cost: base load versus peak load • Consumption • Who: sectors • For what: critical systems or household appliances • When: off-peak or peak
California Electricity Consumption Source: CA Energy Commission, Energy Consumption Data Management System; 2007 All Utility Entities
Commercial Electricity Use by Building Type All Office 24.5% Source: CA Energy Commission, California End-Use Survey, 2006
Lighting Cooling Refrigeration Ventilation 75% Total Lighting 35% Commercial Electricity Usage by End Use Source: CA Energy Commission, California End-Use Survey, 2006
Residential End-Use Electricity Usage Source: End-Use Consumption of Electricity 2001, Energy Information Administration, U.S. Department of Energy
Regional Energy Efficiency Strategy • Outreach, Information & Education • Tools & Programs • Residential, Commercial/Industrial, Local Government • Programs for successful energy efficiency & green fleets programs • Grants Program • Expand existing opportunities • New grant opportunities
Outreach, Education & Information • Healthy Air Living • Targeted Outreach • Local Government • Minority Small Business • Neighborhood Groups • Industrial Regulated Sources • Ag Regulated Sources
Outreach, Education & Information • Comprehensive Energy Website • Energy Efficiency Opportunities Analysis • Model after studies by McKinsey & Company • Look at economics of Energy Efficiency & GHG abatement • Focus on the regional scale • Enlist help from • Valley Colleges & Universities • Regional energy efficiency experts
U.S. Energy Efficiency Supply Curve - 2020 Dollars per million BTU’s saved over lifetime of measure. 80% of opportunity requires deploying 58% of upfront investment. McKinsey & Company, December 2009
Tools & Programs • Residential Programs • Categories of homes • Packaged retrofits • Efficient efficiency • Commercial Programs • Energy audit • Retrofits • Simple work practices • Long-range strategies for sustainable efficiencies & renewables
More Tools & Programs • Industrial Programs • Processes & operations • Office efficiencies • Municipal Programs • Energy policies • Implementation assistance • Fleets • Fuel efficiency, fleet minimization • Alternative fuels • CNG/LNG • Electric with solar recharge
Grants & Incentives • Expand ERIP to include energy efficiency • Broad spectrum of assistance • EE projects that improve air quality • Technical assistance for grant applications • Letters of support from AQ perspective • Grant administration with partners
Partnerships • Coordination is key • Message • Programs • Next two years • SJVCEO • ARRA funds & projects • EE Opportunities Analysis • Utility Partners – best way to reach multiple markets/customers so that efforts are not duplicated
“Kick Start” with ARRA • EECBG Program for small jurisdictions • Regional application • Maximize dollars brought in & energy savings • SEP funding through CEC • Municipal financing opportunities • Comprehensive Retrofit Program • Residential • Commercial • Other grant opportunities – $7.1 million, so far • Alternative fuels & vehicles • Renewable Energy
Implementation • End of 2009 – submit ARRA applications to CEC & initiate programs • February 2010 – EE & RE website • End of 2010 – Energy Efficiency Opportunities Analysis • Ongoing – Outreach & Education; monitor EE savings; monitor emissions reductions • 2011 & beyond – Expand programs & grants opportunities
Review Schedule • Fast Track Task Force – June 16 • Public Workshop – September 2nd • Present draft • Comment period ends September 16th • Revised draft • Governing Board – November 5th
Comment Deadline • 5:00 p.m. September 16, 2009 • Contact: Lisa Van de Water • Mail: San Joaquin Valley APCD 1990 E Gettysburg Ave Fresno CA 93726 • Phone: (559) 230-6100 • Fax: (559) 230-6064 • Email: lisa.vandewater@valleyair.org