Download
1 / 39
390 likes | 519 Views
Combining Phylogenetic and Hidden Markov Models in Biosequence Analysis. Adam Siepel, David Haussler RECOMB’03. Oct. 28, 2005 Presented by Younhee Ko and Jaebum Kim Department of Computer Science. Contents. Motivation Methods Computing the likelihood of a tree model

E N D
Combining Phylogenetic and Hidden Markov Models in Biosequence Analysis Adam Siepel, David Haussler RECOMB’03 Oct. 28, 2005 Presented by Younhee Ko and Jaebum Kim Department of Computer Science
Contents • Motivation • Methods • Computing the likelihood of a tree model • Model of DNA substitution • Allowing for different rates at different sites • Allowing for different categories of sites • Allowing for missing data • An extension of Higher-order states • Implementation and data • Result
Motivation • Necessity for powerful model of sequence analysis • HMMs have become one of the dominant tool • Right balance between simplicity and expressiveness • Important limitation of most HMMs • Fail to use the sequence evolution information • Need to combine the phylogenetic model with HMMs • Improving the realism of models of evolution and the accuracy of phylogenetic inferences.
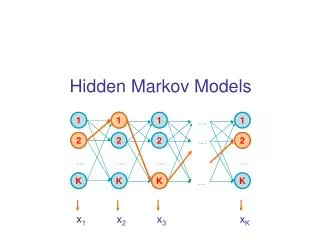
Hidden Markov Model • A 3-state single-sequence HMM, with a multinomial distribution associated with each state
Phylogenetic Tree • Binary tree • Tree topology • Branch lengths(evolutionary time)
Combing the HMM and Phylogenetic tree • Combining Phylogenetic and HMM • HMM • along the length of a sequence (space) • Phylogenetic model • acrossthe sequences(time)
Method • Assumption • Given correct multiple alignment of n sequences of length L • X = {xi,j} • jth character in the ith sequence • Xj = jth column of the alignment • Tree model • Q : substitution rate matrix of dimension • : tree topology • : a vector of branch lengths • : a vector of equilibrium base frequencies xj xi,j
Computing the likelihood of a tree model • The likelihood of a given tree model • With assumption of site independence • Reduce computing the likelihood of each column Xi • Again, it can be reduced the summation of all possible labelings of ancestral nodes of a tree • L is a labeling of the n-1 ancestral nodes of the tree with elements from
U V W Computing the likelihood of a tree model • Felsenstein’s algorithm for • Let u be any node in and let v and w be its children • Let tv and tw be the lengths of the branches connecting u to vand u to w, respectively • The probability of all of the leaves below node u given that the base assigned node u is an a tv tw
Computing the likelihood of a tree model • To find the total likelihood of the column, • For , this procedure will be repeated for each of the L columns in the alignments • The maximum-likelihood tree model
Models of DNA Substitution • P(b|a,t) : probability that a base b is substituted for a base a over a branch of length t • Continuous-time Markov matrix Q={qi,j} • Three substitution models(rate matrix) • Basic assumption • UNREST or UNR substitution model • REV model with constraints “reversibility” • HKY model with single parameter κ , representing the ratio of the rates of transitions to transversions.
Models of DNA Substitution • P(t) : discrete Markov matrix, with rows summing to 1 Q is diagonalizable as , where Λ = diag {Λ1, Λ2 , Λ3, …} • , where eΛt = diag{exp(Λ1t), exp(Λ2t), exp(Λ3t), …}
Allowing for Different Rates at Different Sites • Assumption of original method • Evolution occurs at each site by an identical process • Allowing for different rates at different sites • Can model different rates of substitution • E.g., conserved and non-conserved regions • Tree modelwithout rate • Tree model with rate Rate category + Autocorrelation => Hybrid (this paper)
Allowing for Different Rates at Different Sites • r : random variable having the gamma distribution • Shape parameter α is estimated from data • Simply, scale parameter β is set equal to α , ensuring a mean of 1 • Discrete approximation • Partition the distribution into k rate categories of equal probability • rj (1 ≤ j ≤ k) is equal to the mean of each category • The probability for Xi for given tree model
Allowing for Different Rates at Different Sites • Autocorrelation • Assumption : There are some correlation between the rates of evolution at adjacent sites. • Xi-1 • Assigned to category j • Xi: • Assigned to category j with probability • Assigned to category drawn at random with equilibrium distribution f for all sites with probability 1- • k x k transition probability matrix C = { Cj, i}
Allowing for Different Rates at Different Sites • Hybrid strategy = rate categories + autocorrelation • Assumption : uniform distribution for f • Extended tree model with rate categories and autocorrelation • Step 1: Estimate α, along with Q and β • Step 2: Estimate λ with all other parameters fixed
Allowing for Different Categories of Sites • Generalization of rate variation • Allow for k arbitrary tree models 1,…,k • Different tree models describe different functional categories of site • Can model different patterns of substitution or background distribution • E.g., coding and non-coding regions
Allowing for Different Categories of Sites • cat 1: sites in 1st codon positions • cat 2: sites in 2nd codon positionscat 3: sites in 3rd codon positionscat 4: noncoding sites
Allowing for Different Categories of Sites • A = {aj,l} (1≤j,l≤k) • k x k matrix of transition probabilities • Any site Xi obeys model l, given that the previous site obeys model j • E = { } (1≤i≤L, 1≤j≤k) • L x k matrix of emission probabilities • = (1,…, i,…, L), 1≤i≤k • Assignment of tree models to sites • i : index of the tree model assigned to column Xi • Joint probability of entire alignment X and assignment
Allowing for Different Categories of Sites • Integration of rate categories and functional categories • Evolutionary rate appears to vary at sites of the same functional category • Allow changes in rate within each functional category Fast-evolving coding region rate category 1 functional category 1 Slow-evolving coding region rate category 2 functional category 1
Allowing for Different Categories of Sites • Integration of rate categories and functional categories • k rate categories • q functional categories (tree models 1,…,q ) • F = {fi,j} (1≤i,j≤q) • q x q matrix of transition probabilities among functional categories • C = {ci’,j’} (1≤i’,j’≤k) • k x k matrix of transition probabilities among rate categories • ri,i’ (1≤i≤q, 1≤i’≤k) • Rate constant for the i’th category of i
Allowing for Different Categories of Sites • Integration of rate categories and functional categories • New sequence of kq tree models, • A = {al,m} (1≤l,m≤kq) • kq x kq transition matrix, for all 1≤i,j≤q, and 1≤i’,j’≤q
Allowing for Missing Data • Certain characters in the alignment X do not belong to the alphabet • E.g., Alignment gaps • Simple approach • Discard any column containing a character not in • Undesirable for alignments of divergent sequences • Approach in this paper • Gaps and all other characters not in are regarded uniformly as missing data
Allowing for Missing Data • Xi • Single column of alignment • M • Set of all columns that result from assigning characters from the alphabet in place of missing elements in Xi • Total probability of Xi e.g., Xi=(A,C,C,*,A)TM={(A,C,C,A,A)T, (A,C,C,C,A)T, (A,C,C,G,A)T, (A,C,C,T,A)T}
Allowing for Missing Data • Felsenstein’s algorithm for missing data • Replace “a=xu” with “a matches xu” • “a matches xu”: at a leaf u corresponding to a “*”, for all a
Extension to Higher-Order States • Assumption so far: 0th order states • Emission probability for column Xi at state j, , depends only on column Xi • Nth order states • Emission probability of Xi at state j is conditioned on the previous N columns, Xi-N,…,Xi-1 • Effectively model substitution as a neighbor- or context-sensitive process • E.g, 3rd-codon-position statexi=A has a high probability if xi-2=G and xi-1=A (GAA=Glu)
Extension to Higher-Order States • Felsenstein’s algorithm for dinucleotides (N=1)
Extension to Higher-Order States • Felsenstein’s algorithm for dinucleotides (N=1) • Works exactly as before, except that Q and P(t) are of dimension • At the root r, but now is of dimension • Can be obtained as before from
Extension to Higher-Order States • Substitution rate matrix Q for dinucleotides (N=1) • Prohibit instantaneous changes for more than one base • Reduce the number of free parameters • Three alternatives • Fully reversible matrix(R2) (48 free parameters) • Strand-symmetric reversible matrix(R2S) (24 free parameters) • Strand-symmetric unrestricted matrix(U2S) (48 free parameters) • E.g., R2 matrix Q={qi1i2j1j2} (1≤i1,i2,j1,j2≤||)
Extension to Higher-Order States • We need conditional rather than joint probabilities • Can be computed by two passes through Felsenstein’s algorithm • One pass for numerator • One pass for denominator • Can be regarded as an instance of the missing data problem • is the same as with
Implementation and Data • Implemented substitution models • Nucleotides: HKY, REV, UNR • Dinucleotides: R2, R2S, U2S • Implemented rate models • Constant rates model • Discrete gamma model with k=4 • Autocorrelation model (w/ discrete gamma model) with k=4 • Training and testing data • Human sequence (CFTR gene) • Homologous sequence from 8 other eutherian mammals • Focus of analysis (two subsets of sites) • ARs (Ancestral repeats): reflect neutral evolution • WNT2: Contains significant representation from all functional classes
Implementation and Data • Phylogenetic tree
Results • Experiment 1 • Increasing richness for base substitution and for rate variation (single functional category) • Data: AR alignment • Experiment 2 • Contrast coding and neutral DNA • Data: All bases in the 2nd codon position (coding DNA) • Experiment 3 • Effect of considering functional categories • Data: WNT2
Results • Experiment 1
Results • Experiment 2
Results • Experiment 34 Category:1st, 2nd, 3rd codon and other6 Category:1st, 2nd, 3rd codon,introns, 5’UTR sites andintergenic sites
Conclusion • Phylogenetic hidden Markov model • New model of molecular evolution • Capture both spatial and temporal aspects of the process • Space: HMM (along the length of a sequence) • Time: Phylogenetic model (across sequences) • Allow missing data, autocorrelated rate variation, functional category and higher order states • Goodness of fit of such a model is improved by • Autocorrelated rate variation • Multiple functional categories • Higher order states
References • Z. Yang. A space-time process model for the evolution of DNA sequences. Genetics, 139:993-1005, 1995 • J. Felsenstein and G. Churchill, A hidden Markov model approach to variation among sites in rate of evolution. Mol. Biol. Evol., 13:93-104, 1996 • A. Siepel and D. Haussler. Phylogenetic hidden Markov models. Statistical Methods in Molecular Evolution, pp. 325-351, Springer, New York, 2005