Download
1 / 45
450 likes | 658 Views
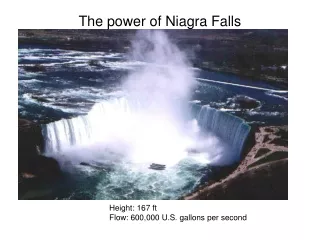
. Frozen Niagra Falls. GEOS 110 Fall 2010 Introduction to Cryosphere Part 1 Fall 2011. Antarctic: Continent landmass covered with glacial ice surrounded by Ocean. Arctic: Deep Ocean surrounded by Land and world’s largest continental shelves. 5. Average depth of Arctic Ocean:

E N D
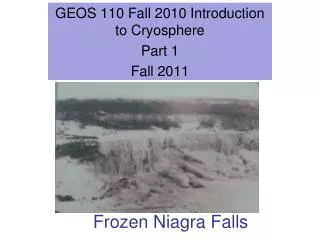
.Frozen Niagra Falls GEOS 110 Fall 2010 Introduction to Cryosphere Part 1 Fall 2011
Antarctic: Continent landmass covered with glacial ice surrounded by Ocean Arctic: Deep Ocean surrounded by Land and world’s largest continental shelves 5
Average depth of ArcticOcean: 1038 meters (3407 ft) Deepest point in the Eurasian Basin: 5450 meters (17,881 ft). Entire basin :approximately the area of Canada 6
Earth’s north pole is in the Arctic Ocean over the deep Eurasian Basin 60% of the Arctic ocean is underlain by shallow continental shelves -- the widest in the world www.ngdc.noaa.gov/mgg/image/IBCAO_betamap.jpg 7
Greenland Ice sheet If it melted, the water would return to the sea and raise global sea level ~ 6.5 m Image: ACIA 8
Antarctica EAST WEST 10
Impact of Sun on Temperature 400 300 200 100 0 Global Radiation (W/m2) GEBCO Temperature in the Beaufort Sea The annual cycle of global radiation (brown line) and surface air temperature (blue line) at a grid cell location in the central Beaufort Sea. Values were drawn from the Arctic Meteorology and Climate Atlas gridded fields for global radiation and two-meter air temperature. 12
Cryosphere/Sea Ice 1979 2003 Sea ice extent in the Arctic has a huge impact on albedo - reflectivity of Earth’s Surface 13 2010-2030 2040-2060
Why the Arctic Warms Faster UAF: ACIA 14
Why the Arctic Warms Faster A Critical Reason is that: UAF: ACIA 15
Snow and Ice Feedbacks Processes which contribute to the amplification or decrease in rate of change are called feedback mechanisms Snow covered ice reflects about 80% but open water absorbs >90%. 17 Melting Ice Report, 2009
Snow and Ice Feedbacks, cont…. Processes which contribute to the amplification or decrease in rate of change are called feedback mechanisms As snow and ice melts, darker land and water absorb more of sun’s heat 18 Melting Ice Report, 2009
Understanding and Projecting the Changes in the Oceanic Conveyor Belt is a Critical Question for Science Thermohaline Circulation 21
Earth in the Balance The snow and ice that cover the Arctic reflect about 90% of the sun's energy, so the Arctic is constantly losing heat. http://www.aquatic.uoguelph.ca/oceans/ArticOceanWeb/Currents/frontpagecur.htm However, the ocean currents also exchange heat: currents from the Atlantic bring warm water into the Arctic, while currents traveling southwards discharge cold water. 22
Arctic inflow Arctic outflow The North Atlantic Current provides about 60% of the inflow to the Arctic Ocean bringing warmer water from the Atlantic Ocean. Some water also moves into the Arctic Ocean from the Bering Sea and the Pacific Ocean, by way of the Bering Strait. Water flows from the Arctic Ocean into the Pacific and Atlantic Oceans, as well as into a number of surrounding seas. By far, the greatest volume of water leaves the Arctic Ocean through the passage between Greenland and Spitsbergen. 23
The Changing Arctic: Greenland • Increase in snowfall • Increase in melt at edges • Melt exceeds snowfall • Laser altimeter measurements from aircraft • GPS Tracking of ice movement 24
The Changing Antarctic Larsen B Ice Shelf Collapse (2002) National Geographic Society map 25
The Changing Antarctic • Ice Shelves • floating • melting does not raise sea level • buttress ice sheets covering Antarctica (“hold the ice back”) Wilkins Ice Shelf Wilkins Ice Shelf began break up in March, 2008 26 http://nsidc.org/news/press/20080325_Wilkins.html
Wilkins Ice Shelf Collapse – late March and early April 2009 27
An expected consequence of global warming is a decrease in the Earth’s snow and ice cover, which would increase the global absorption of solar radiation and, in the event of a significant melting of land ice, increase sea level. An expected consequence of global warming is a decrease in the Earth’s snow and ice cover, which would increase the global absorption of solar radiation and, in the event of a significant melting of land ice, increase sea level.
Ice and snow profoundly affect world climate. During the Northern Hemisphere winter, they blanket up to 16% of the Earth’s surface with a bright covering that reflects much of the Sun’s radiant energy back to space. During the Southern Hemisphere winter, they cover about half this area
Satellite data provide the best means of monitoring the global ice coverage and its variability. Visible and infrared sensors provide high-resolution images under sunlit and cloud-free conditions, while microwave sensors provide observations under dark or light conditions and cloudy or cloud-free conditions, generally with less spatial detail.
Change in Elevation thinning no change thickening Accurate measurements of the changes in the Greenland and Antarctic ice sheets are critical in quantifying forecasts for sea level rise. Since its launch in January 2003, the Ice, Cloud, and land Elevation Satellite (ICESat) has been measuring the change in elevation of these ice sheets. This image shows the changes in elevation of the Greenland ice sheet between 2003 and 2006. The white and yellow regions indicate a slight thickening, while the blue and purple shades indicate a thinning of the ice sheet. Data from the Geoscience Laser Altimeter System (GLAS) on the ICESat satellite. THINNING THICKENING
Sept. 21, 1979 Sept. 16, 2007 Sea Ice Conc entration (%) 0 15 100 Minimum, or near minimum, Arctic sea ice extent and concentration from 1979 and 2007. In 2007, the late summerice extent was about 25% smaller and the late winter ice extent was about 6% smaller than the averages over the 28-year period. On average, ice at the summer minimum has been decreasing at a rate of about 9-10% per decade, with the annually averaged ice cover decreasing at the lesser rate of about 4-5% per decade. In contrast, Antarctic sea ice has increased. Minimum, or near minimum, Arctic sea ice extent and concentration from 1979 and 2007. In 2007, the late summer ice extent was about 25% smaller and the late winter ice extent was about 6% smaller than the averages over the 28-year period. On average, ice at the summer minimum has been decreasing at a rate of about 9-10% per decade, with the annually averaged ice cover decreasing at the lesser rate of about 4-5% per decade.
5 km Africa South America South Pole Australia Pine Island Glacier, western Antarctica, as seen on December 12, 2000 in the process of shedding an iceberg Pine Island Glacier, western Antarctica, as seen on December 12, 2000 in the process of shedding an iceberg increases in temperature where the ice meets the surrounding Amundsen Sea, showing thinning, increasing ice flow, and a rapidly retreating grounding line, where the ice meets the ground underneath. Sea ice cover in front of the glacier has been decreasing over the past few decades.
Eastern Greenland during the period of summer thaw, July 13, 2007.
April 2005 July 2005 Greenland Canada Russia PacificOcean October 2005 January 2006 July 2005 SNOW COVER The four globes to the left show seasonal snow cover over land for the Northern Hemisphere from April 2005 to January 2006 (note that sea ice and its snow cover are not shown). The various colors represent percentages of snow cover. The gray circle in October and January indicates no sunlight available. October 2005 January 2006
Ice sheets and glaciers are important reservoirs for fresh water. Approximately 75% of the world’s fresh surface water is stored in ice, the remainder being stored underground or in lakes, rivers and streams. Of the 75% in ice, approximately 91% is held in the Antarctic ice sheet, 8% in the Greenland ice sheet, and the remaining 1% in mountain glaciers, which exist on every continent except Australia. Over the past century, sea level has slowly been rising. This is in part due to the expansion of ocean water as it warms and in part due to the addition of water to the oceans through either the melting or the calving off of icebergs from the world’s land ice. A vast majority of individual mountain glaciers and ice caps are known to have been retreating, some very rapidly, and their melt and consequent runoff contribute to sea level rise. Ice sheets and glaciers are important reservoirs for fresh water. Approximately 75% of the world’s fresh water is stored in ice, the remainder being stored underground or in lakes, rivers and streams. Of the 75% in ice, approximately 91% is held in the Antarctic ice sheet, 8% in the Greenland ice sheet, and the remaining 1% in mountain glaciers, which exist on every continent except Australia. Over the past century, sea level has slowly been rising. This is in part due to the expansion of ocean water as it warms and in part due to the addition of water to the oceans through either the melting or the calving off of icebergs from the world’s land ice. A vast majority of individual mountain glaciers and ice caps are known to have been retreating, some very rapidly, and their melt and consequent runoff contribute to sea level rise. Although scientific evidence is increasing that on balance, both the Greenland and Antarctic ice sheets are shrinking, it is still uncertain what impact this will have on the world’s population. If all the ice melted or otherwise entered into the oceans, global sea level would rise by approximately 70 meters. There is much ongoing research into exactly how both ice sheets are changing and how the mechanisms that control these changes workСnot only measuring the elevation of the ice but also examining the outward flow of the ice and the mechanisms that might speed the flow of the ice into the oceans. Satellites are playing a crucial role in these studies, and when combined with observations from the field and from aircraft, as well as sophisticated models, scientists can develop a complete picture of how the ice is changing and why. Scientists use satellite altimeters such as the one on ICESat to measure changes in ice sheet elevation. ICESat has an instrument that fires laser pulses toward the Earth’s surface and very accurately measures the time it takes the light to travel from the satellite to the surface and back. Since scientists know how fast light travels in air, they can convert this time measurement into a distance measurement. Combining that measurement with the precise location of the satellite (determined by GPS), they can calculate the ice elevation. Scientists make these precise elevation measurements over the entire surface of the ice sheet for several years, which allows them to estimate the ice sheet’s volume change and its consequent contribution to sea level change.
If all the ice melted or otherwise entered into the oceans, global sea level would rise by approximately 70 meters. There is much ongoing research into exactly how both ice sheets are changing and how the mechanisms that control these changes work—not only measuring the elevation of the ice but also examining the outward flow of the ice and the mechanisms that might speed the flow of the ice into the oceans. Satellites are playing a crucial role in these studies, and when combined with observations from the field and from aircraft, as well as sophisticated models, scientists can develop a complete picture of how the ice is changing and why. Ice sheets and glaciers are important reservoirs for fresh water. Approximately 75% of the world’s fresh water is stored in ice, the remainder being stored underground or in lakes, rivers and streams. Of the 75% in ice, approximately 91% is held in the Antarctic ice sheet, 8% in the Greenland ice sheet, and the remaining 1% in mountain glaciers, which exist on every continent except Australia. Over the past century, sea level has slowly been rising. This is in part due to the expansion of ocean water as it warms and in part due to the addition of water to the oceans through either the melting or the calving off of icebergs from the world’s land ice. A vast majority of individual mountain glaciers and ice caps are known to have been retreating, some very rapidly, and their melt and consequent runoff contribute to sea level rise. Although scientific evidence is increasing that on balance, both the Greenland and Antarctic ice sheets are shrinking, it is still uncertain what impact this will have on the world’s population. If all the ice melted or otherwise entered into the oceans, global sea level would rise by approximately 70 meters. There is much ongoing research into exactly how both ice sheets are changing and how the mechanisms that control these changes workСnot only measuring the elevation of the ice but also examining the outward flow of the ice and the mechanisms that might speed the flow of the ice into the oceans. Satellites are playing a crucial role in these studies, and when combined with observations from the field and from aircraft, as well as sophisticated models, scientists can develop a complete picture of how the ice is changing and why. Scientists use satellite altimeters such as the one on ICESat to measure changes in ice sheet elevation. ICESat has an instrument that fires laser pulses toward the Earth’s surface and very accurately measures the time it takes the light to travel from the satellite to the surface and back. Since scientists know how fast light travels in air, they can convert this time measurement into a distance measurement. Combining that measurement with the precise location of the satellite (determined by GPS), they can calculate the ice elevation. Scientists make these precise elevation measurements over the entire surface of the ice sheet for several years, which allows them to estimate the ice sheet’s volume change and its consequent contribution to sea level change.
Scientists use satellite altimeters such as the one on ICESat to measure changes in ice sheet elevation. ICESat has an instrument that fires laser pulses toward the Earth’s surface and very accurately measures the time it takes the light to travel from the satellite to the surface and back. Since scientists know how fast light travels in air, they can convert this time measurement into a distance measurement. Combining that measurement with the precise location of the satellite (determined by GPS), they can calculate the ice elevation. Scientists make these precise elevation measure- ments over the entire surface of the ice sheet for several years, which allows them to estimate the ice sheet’s volume change and its consequent contribution to sea level change.
10 km Since measurements of the Jakobshavn Glacier were first taken in 1850, the glacier calving front has gradually receded until the 1960s, where it came to rest for nearly 40 years. In the six years between 2001 and 2006 it retreated approximately the same distance as in the preceding sixty. As this floating ice that has been wedged in the Jakobshavn channel retreated, the ice stream that feeds it—one of the fastest in the world—responded dramatically by doubling its speed to about 1.5 m per hour. This kind of acceleration in response to retreating calving fronts is not unique to Jakobshavn glacier, and is important because it controls how much and how rapidly ice flows into the surrounding seas, contributing to sea level rise. The Jakobshavn Ice Stream is Greenland’s largest outlet glacier, draining 6.5% of Greenland’s ice sheet area. Its doubling of speed in the last few years has increased the rate of sea level rise by about .06 millimeters per year, or roughly 4% of the average 20th century rate of sea-level increase.
sea ice Trall Denmark Strait Kong Oscar Fjord Scoresby Land Jameson Land Scoresby Sound sea ice Summer thaw was underway in eastern Greenland when the data for this image were collected on July 13, 2007. Snow and ice inland (left) form a white blanket, while closer to the sea (to the right of the whitest areas) the annual snow has retreated from much of the rocky coastline and from the surfaces of some glaciers. In the fjords, meltwater carries finely ground sediment crushed by the movement of glaciers over rock. Sea ice (bottom center) has fractured into blocks, and small chunks of ice are scattered in some fjords like confetti. At far right, ice has disintegrated or been crushed into such small pieces that it looks like froth or foam swirling in the waters of the Greenland Sea. This image is centered on an area of Greenland located about midway along the island’s eastern coastline. The section is bordered on the south by the Kangertittivaq, or Scoresby Sound. The sound is just north of 70 degrees north latitude. While the land around it appears barren and rocky, the north bank is actually vegetated. The grasses and low-growing tundra plants that survive there allow the area to support wildlife, including populations of mammals such as musk ox, lemmings, and Arctic foxes and hares, as well as land birds such as snow buntings, snowy owls, and Gyrfalcons.
Using data from the Moderate Resolution Imaging Spectroradiometer (MODIS) flying on NASA’s Terra and Aqua satellites, researchers have assembled the most detailed map of Antarctica’s snowy surface yet produced. Called the Mosaic of Antarctica (MOA), this map shows the continent in unprecedented detail. The MOA map includes all land areas south of 60 degrees South that are bigger than a few hundred meters.
Terra The Terra mission, launched in December 1999, carries five instruments, three of which provide significant contributions to snow and ice studies. These are the Advanced Spaceborne Thermal Emission and Reflection Radiometer (ASTER), the Multi-angle Imaging SpectroRadiometer (MISR), and the Moderate Resolution Imaging Spectroradiometer (MODIS). The primary goal of ASTER is to gather data in 14 channels over targeted areas of the Earth’s surface, as well as black-and-white stereo images. ASTER provides the capability for repeat coverage of changing areas on the Earth’s surface with spatial resolutions of between 15 and 90 meters (49.2 and 295.2 feet) and augments the Landsat database, which was started in 1972. Together, the Landsat and ASTER data provide scientists with the ability to determine the rates that glaciers are advancing or receding. MISR measures the amount of sunlight that is scattered in different directions under natural conditions using nine cameras mounted at different angles. As the instrument flies overhead, each section of the Earth’s surface is successively imaged by all nine cameras in four wavelength bands. MODIS provides a comprehensive series of global observations every one or two days at spatial resolutions of up to 250 meters (820 feet). It provides the frequent observations necessary for multi-disciplinary studies of land, ocean and atmospheric interactions that enable us to understand more fully many of the critical issues affecting our environment. Among the variables being examined with MODIS data are glaciers, snow cover, and sea ice.
Landsat 7 Landsat 7 is the latest in a series of satellites that have provided calibrated Earth science data to both national and international users since 1972. Landsat 7 data have been used to monitor agricultural productivity, urban growth, and land-cover change, and are used widely for oil, gas, and mineral exploration. Other science applications include monitoring volcanoes, glacier dynamics, agricultural productivity, and coastal conditions. While other EOS instruments acquire frequent, coarse views of land-cover change, the higher spatial resolution of data from the Enhanced Thematic Mapper Plus (ETM+) instrument on Landsat 7 may help researchers to determine the actual causes of observed land-cover changes. These changes have important implications, both for local habitability and for the global cycling of carbon, nitrogen, and water. ICESat The Ice, Cloud, and land Elevation Satellite (ICESat) measures the height of the Earth’s polar ice masses, land and ocean surfaces, as well as clouds and aerosols in the atmosphere using advanced laser technology from a platform precisely controlled by star-trackers and the on-board Global Positioning System (GPS). ICESat’s Geoscience Laser Altimeter System (GLAS) instrument was developed at the Goddard Space Flight Center, as part of NASA’s Earth Observing System, and was launched in January 2003. ICESat scientists are examining whether the great polar ice sheets are shrinking and how these ice masses may change under future climate conditions. ICESat is also helping us understand how clouds affect the heating and cooling of the Earth, is mapping vegetation heights, and should enable production of the most accurate maps of land topography. ICESat is designed to operate for 3-5 years and should be followed by successive missions to measure elevation changes for 15 years.