Download
1 / 33
440 likes | 728 Views
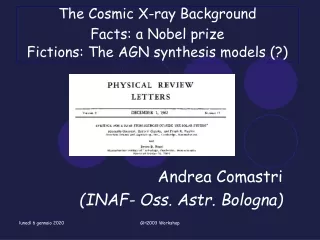
Obscured AGN and the synthesis of the cosmic X-ray background. The discovery of the cosmic X-ray background (XRB). 2-6 keV data. Counts > 0 from all directions diffuse background radiation. Giacconi et al. (1962). Nobel prize in 2002 . ROSAT image of the moon (0.5-2 keV).

E N D
Obscured AGN and the synthesis of the cosmic X-ray background
The discovery of the cosmic X-ray background (XRB) 2-6 keV data Counts > 0 from all directions diffuse background radiation Giacconi et al. (1962). Nobel prize in 2002
ROSAT image of the moon (0.5-2 keV) The moon casts a shadow on the XRB
All sky X-ray maps ROSAT E ~ 0.25 keV G a l a c t i c p l a n e HEAO-1 E ~ 10 keV: Galaxy transparent at these these energies XRB isotropy: ~3% on deg2 scales - isotropy suggests an extragalactic origin G a l a c t i c p l a n e
Cosmic backgrounds at different wavelengths CMB Optical = stars Infrared= Stars (+AGN?) nIn X-ray Background = AGN softhard 2 keV
The spectrum of the cosmic XRB The first spectral data (1980) in the 3-60 keV band could be reproduced accurately by thermal emission from an optically thin plasma: F(E)~ E-0.29e-E/41keV (bremsstrahlung)
Can diffuse plasma explain the XRB spectrum?? No! 1) subtracting AGN no more bremsstrahlung 2) CMB perfect blackbody; hot gas (T~40 keV ~ 4 108 K) would produce distortions by inverse Compton effect Emission by unresolved faint individual sources AGN
The deepest X-ray fields and the resolved XRB fraction 2Ms Chandra Deep Field North 1Ms Chandra Deep Field South red = 0.3 -1 keV green = 1 - 2 keV blue = 2 -7 keV 20 arcmin Limiting flux ~2 10-17 erg/cm2/s in the 0.5-2 keV band 2Ms Chandra = 20 days integration time
Resolved XRB in the Chandra Deep Fields Most (50-80%) of the E < 10 keV XRB is resolved into single sources From Worsley et al. (2005)
AGN X-ray spectra: indices and units Primary component of AGN X-ray spectra: power law with a high energy cutoff. Energy spectrum • F(E) = E-a e-(E/Ec) in keV/cm2/s/keV Photon spectrum: • N(E) = E-G e-(E/Ec) in photons/cm2/s/keV • F(E) = E x N(E) E-α = E x E-Γ= -(Γ-1) Γ = α+1 α= spectral index; α ~ 0.7 - 1.0 Γ= photon index; Γ ~ 1.7 - 2.0 Ec=high energy cut off; Ec ~ 100 – 500 keV (highly uncertain)
Hot electrons Accretion disk Black hole The components of the AGN X-ray spectrum observer a ~ 0.9 Primary powerlaw Soft excess Compton reflection continuum Iron Kα line F(E) = C E-a e(-E/Ec) [1+ A(E) ] + BB(E) + G(E)
Examples of X-ray spectra Compton-hump High energy cut-off Iron emission line Seyfert 1 Seyfert 2
Spectral paradox: the X-ray spectra of bright, unobscured AGN is too steep (α~0.9) to produce the XRB spectrum in the 2-10 keV band (α~0.4) The contribution from obscured AGN is fundamental XRB spectrum: α=0.4 Unobscured AGN spectrum: α=0.9
The unified model Antonucci & Miller (1985) Figure by Urry & Padovani (1995)
Two well known AGN.. QSO Seyfert 2
Reflected component observer T<105 K Transmitted component NH=1021-1025 cm-2 1-100 pc Obscured AGN Fabs(E) ~ Funabs e-NHσE + Funabs Atorus(E)
Cross sections σE = cross section for Photoelectric absorption σT = cross section for Thomson scattering NH = hydrogen equivalent column density units : cm-2 Cosmic abundances σE ~ E-2.5 Iobs(E)/Iint(E) ≈e-τ τ=NHσE σE≈E-2.5 Nuclear emission is transparent at high energies Iron edge at 7.1 keV σT H + He only σT>σE at E> 10 keV Absorption of X-ray photons is produced by metals
Photoelectric absorption + scattering Iobs(E)/Iint(E) ≈e-t t = NHs Dashed line = photoelectric absorption only Solid line = absorption + scattering For NH>σT-1~1.5 1024 cm-2 scattering contributes significantly to the total opacity. These objects are called Compton-thick.
Reflected component observer Transmitted component AGN X-ray spectral templates with different NH Unabsorbed: logNH<21 Compton-Thin: 21<logNH<24 Compton-Thick: Mildly (log NH =24-25) Heavily (log NH >25) The cold gas in the torus contributes to the iron Kα line emission. Only about 40 C-thick AGN (10 mildly-thick) known so far As NH increases, the spectrum is absorbed towards higher and higher energies.
Examples of Compton-thick AGN Mildly thick IRAS 09104+4109 logNH~24 Mildly thick Transmitted component logNH~24 heavily thick Reflected component logNH>25 Seyfert 2 NGC4595 : logNH~24 reflection + transmission Seyfert 2 NGC1068 : logNH>25 only reflection
frazione • 22 23 24 25 • logNH The number of obscured AGN and relative NH distribution is known with someaccuracy only in the local universe: the cosmological evolution of the NH distributionand of the abs/unabs AGN ratio is still poorly known.. From Risaliti et al. (1999) In the local Universe it is estimated that absorbed AGN outnumber unobscured ones by a factor of >4, and that half of them are Compton-thick (N thick ~ N thin): therefore, about 80-90% of the local AGN population is obscured.
Synthesis of the XRB I X-ray spectrum X-ray luminosity function I(E)=cosmic XRB intensity . Usually in units of keV/cm2/s/sr/keV
AGN luminosity function in the soft band(unobscured AGN only) Luminosity dependent density evolution (LDDE): evolution rate is higher for high luminosity objects From Hasinger, Miyaji & Schmidt (2005)
AGN cosmological evolution Number density Luminosity density Objects with lower luminosity peak at lower redshift, similar to what observed for SFR in galaxies: downsizing
R ( high lum ) R ( low lum ) Hard band (2-10 keV) LF: unabs + Compton-thin AGN Unabsorbed AGN (from soft XLF) Total Compton-thin AGN (abs/unabs ratio decreasing with increasing Lx) Total Compton-thin AGN (constant abs/unabs ratio) Best fit thin/unabs ratios: ~ 4 for Log Lx ~ 42 erg/s ~ 1 for Log Lx ~ 45 erg/s
Dependence of the obscured AGN fraction on X-ray luminosity and redshift From Ueda et al. (2003) Broad consensus for an obscured AGN fraction declining towards high intrinsic luminosities Behavior with z still debated (see e.g. La Franca et al. 2005)
N thick = N thin The fit to the XRB spectrum COMPTON-THICK AGN NECESSARY TO FILL THE 30 KEV GAP INTEGRAL: Churazov et al. 2007; SAX PDS: Frontera et al. 2007, submitted
AGN number countslogN-logS relation: source counts above a given flux S. At bright fluxesunobscured AGN dominates, while the contribution from obscured sourcesincreases towards fainter fluxes. For a Euclidean Universe: N(>S) ~ S-1.5 [cgs] = erg/cm2/s
Compton-thick candidates in the CDFS (Tozzi et al. 2006) Obscured AGN fraction vs sample limiting flux 2-10 keV samples Swift/BAT (> 10 keV) sample All abs. All abs. Thick Thick Compton-thick AGN are present in very small numbers in current samples
Where to look for Compton-thick AGN (IR?) Unabs AGN Compton-thick AGNs (CDFS202, NGC6240) From Fiore et al. (2007) From Norman et al. (2002) Radiation absorbed by the torus re-radiated in the IR band: X-ray stacking of sources which are not detected individually in the X-rays but show a mid-IR excess wrt to stellar emission From Daddi et al. (2007) Large population of C-thick AGN candidates at z~2 (N thick ≥ N thin)
Evidence for supermassive black holes (SMBH) in local galaxies: did they grow through efficient accretion -i.e. AGN- phases? Linear relations between black hole mass and bulge mass or luminosity On average: MBH/Mbulge ~0.002 = IR luminosity (K-band) From Marconi & Hunt (2003) By combining these relations with the galaxy luminosity function, it is possible to derive a local SMBH mass function
The local SMBH mass function By integrating the SMBH mass function in nearby galaxies one gets a total density of SMBH of: ρ= 3-5 × 10⁵ M Mpc-3
L = AGN luminosity η = radiative efficiency Macc =accretion rate towards the BH MBH = Black Hole growth rate . . } . L = η Macc c2 MBH=(1- η)Macc . . . . MBH= [(1- η)/ η] L/c2 ρ = [(1- η)/ η] UT/c2 MBH= [(1- η)/ η] L/c2 The mass density of ‘relic’ SMBH By integrating the AGN emission over cosmic time: ρ = mass density of relic BH UT = bolometric AGN energy density UX = X-ray AGN energy density Uunabs = energy density of unobscured AGN R = total/unabs AGN ratio Kbol = bolometric correction (i.e. the ratio between bolometric and X-ray AGN luminosity) UT = kbol UX = kbol R Uunabs ρ = [(1- η)/ η] kbol R Uunabs/c2 Uunabs By substituting the appropriate values for η, kbol, R, Uunabs, one gets: ρ~4 × 10⁵ M Mpc-3 local SMBH appear to have formed through active phases during the galaxies’ lifetime kbol=Ftot/Fx~20